
Odd Ones Out
Mapping Britain's social values and the marginalisation of the 'anti-woke'

You know, they say you can’t influence politicians or policy-makers through academic work or blogging. And yet, since my recent posts on immigration policy and on Labour’s positioning on cultural issues, the Labour Party have done exactly the opposite of what I recommended. So if that’s not influence, I don’t know what is.
Which has me slightly concerned about what kind of George Costanza opposite strategy might emerge from today’s post. Accordingly, let’s not focus on the government of the day, lest I inadvertently encourage them to set fire to every university in the country.
Instead let’s stand back from the merits or demerits of Labour’s electoral / policy strategy and look more broadly at the distribution of social attitudes in the country across voters for various parties. Because I think it’s quite interesting to get a sense of where average views are and whose voters are more or less ‘in touch’ with public sentiment more generally.
From the reception of my two previous posts, I guess people like bubbles. Well if you’ll indulge me then I have one more series of bubble-plots to look at. This time, my skepticism is not aimed at the choices of Labour strategists. They can take a well-earned break, have a cuppa, ward off some angry members of the PLP, whatever it is they do with their free time.
No, this time I want to look at people attracted to Reform, and their distinctiveness from other voters. Not completely of course - Reform could not attract thirty odd percent of the vote choice of those people providing the name of the party they intend to vote for (note the wording, don’t knows are a huge group now), if they were completely unlike the rest of the country. But they are quite distinct - an unrepresentative, ‘out of touch’ clique if you will - which rather makes the claims that they are the true voice of the country less than convincing to me.
Regular readers will recall the core graph from my analysis a month or so back, which placed voters for Britain’s parties on a two-dimensional plot, with economic attitudes on one dimension and cultural ones on the other. These dimensions were created using factor analysis on several classic questions trying to tap those underlying attitudes, drawing on 30,000 or so voters in the British Election Study in May 2025. This survey also asked vote intention in the next general election and for various demographics, such as as occupation, which I used to separate out voters. Lots of details in the old article. Here’s that graph again:
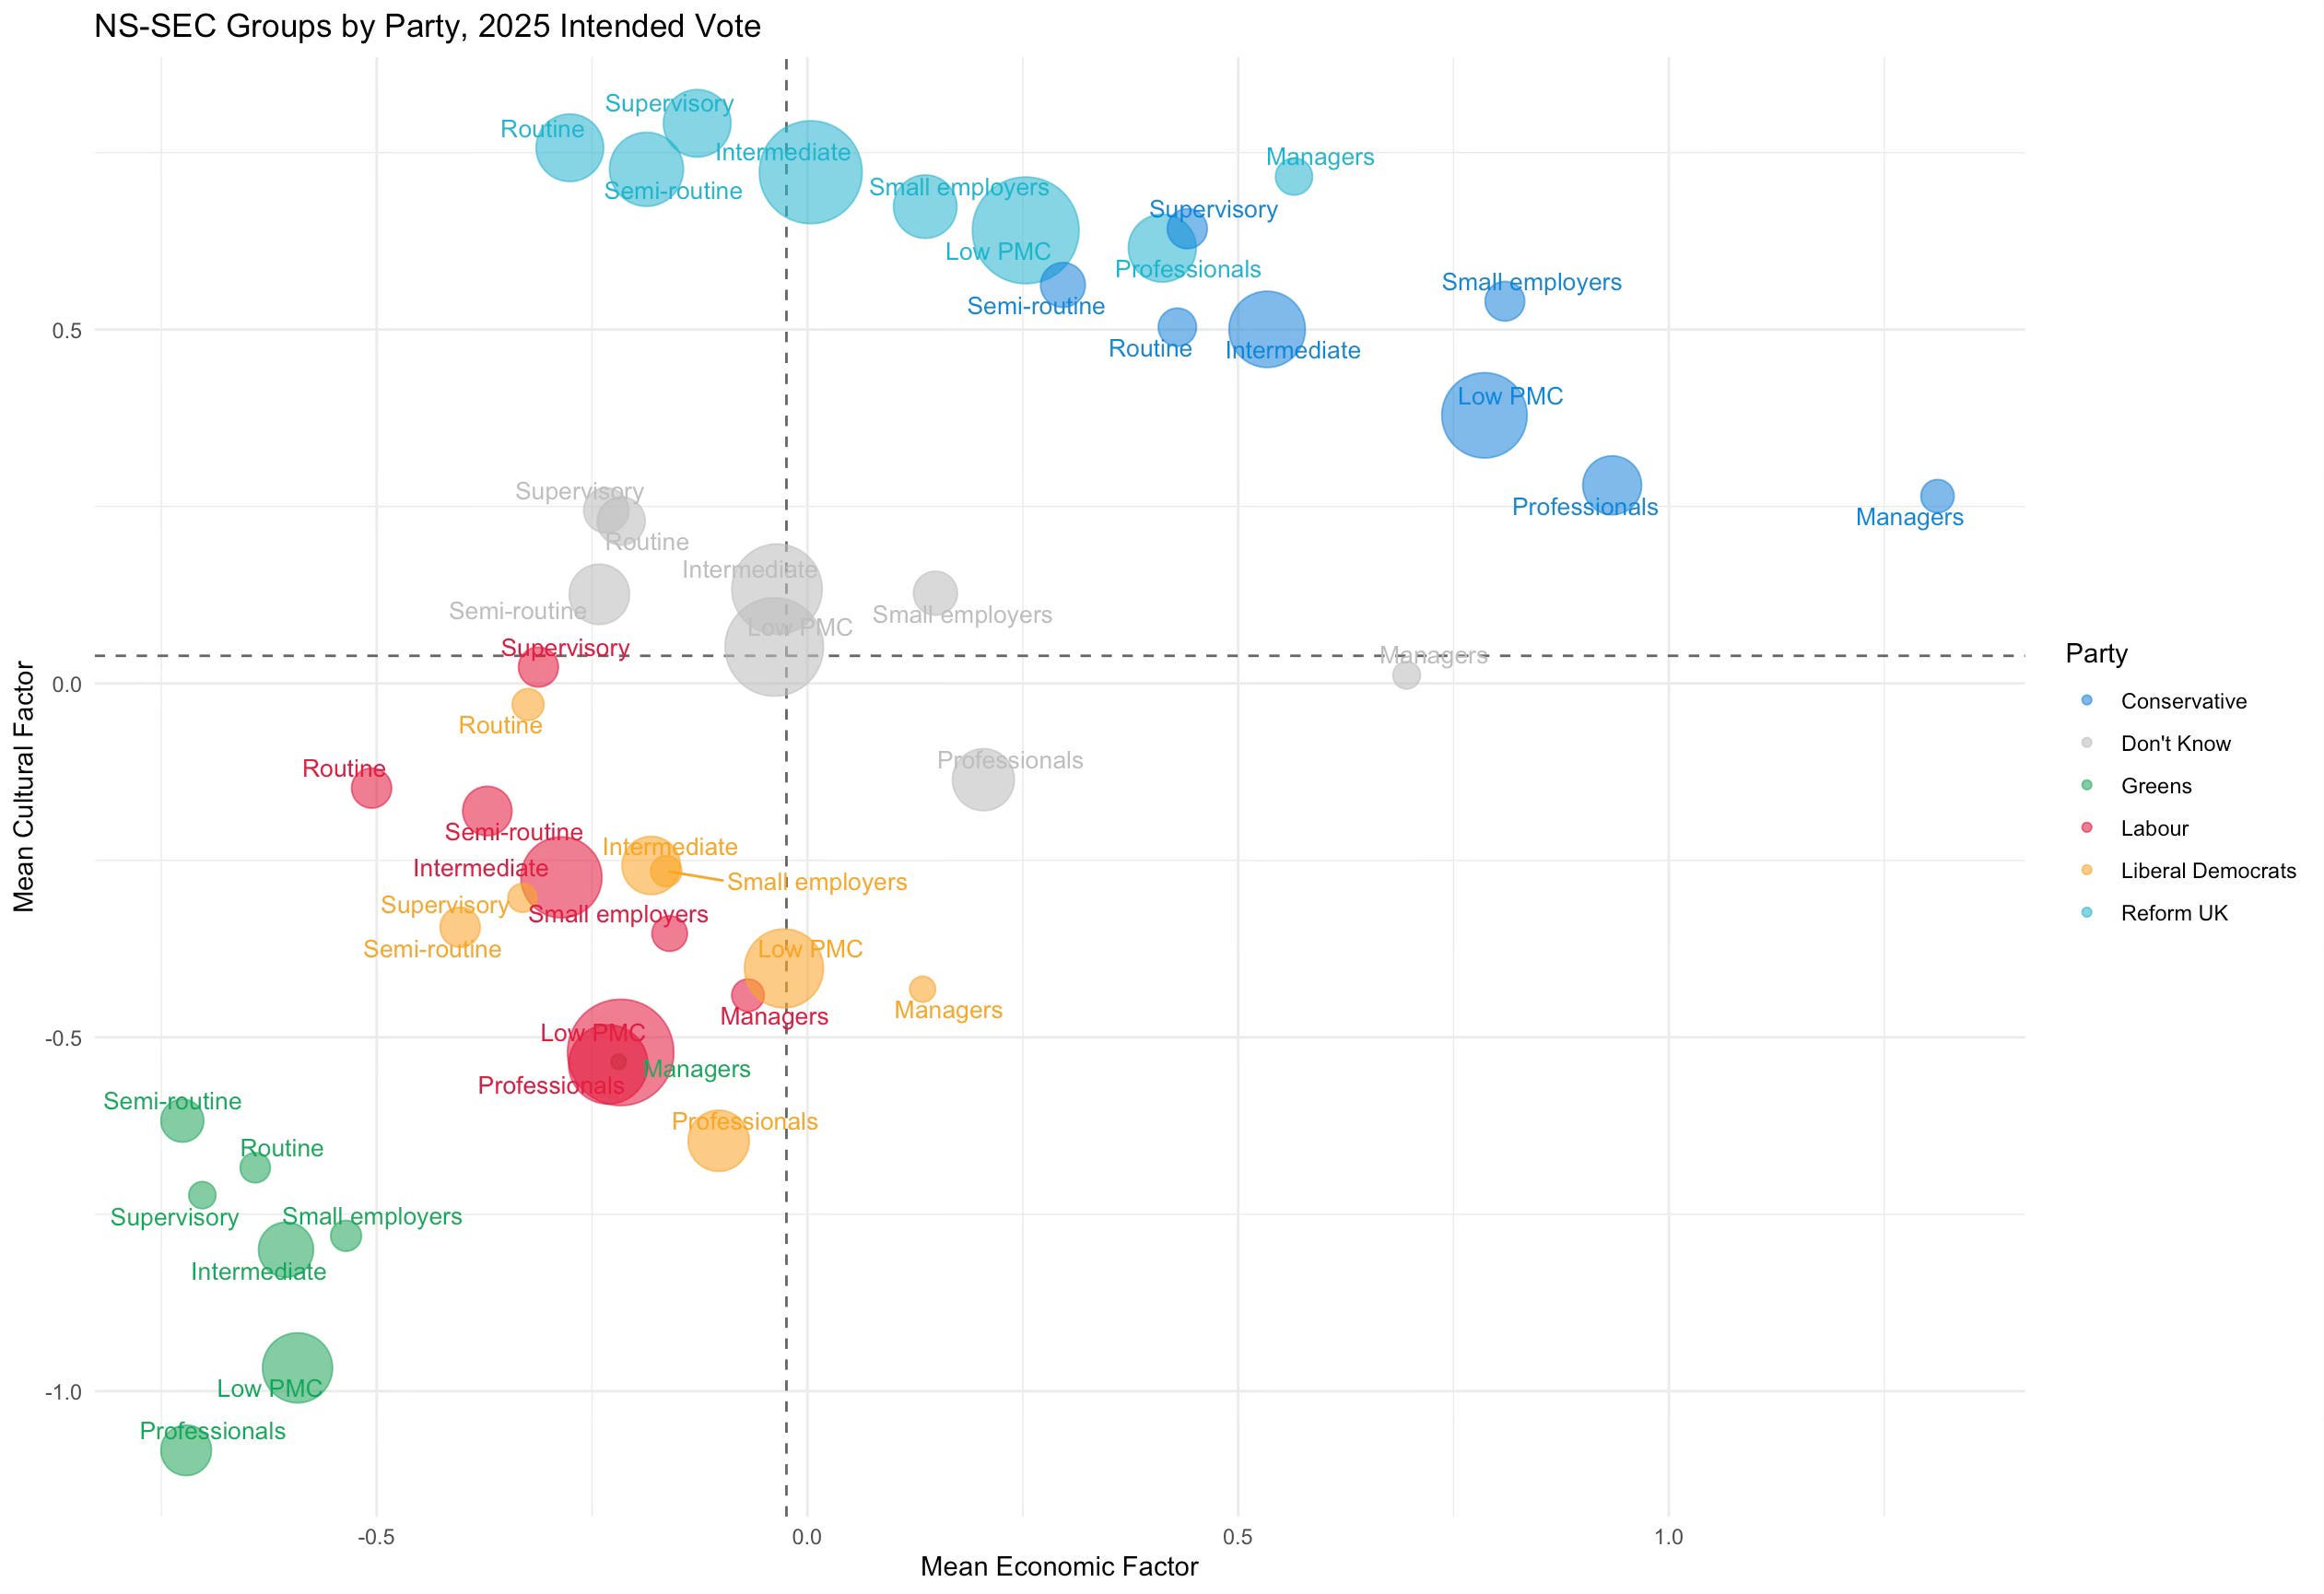
I like this graph. I think it tells us a lot about both class politics and more importantly the relative importance of vote intention versus occupational type. Basically, Vote Choice Rules Everything Around Me (V-CREAM?).
But it raises a couple of questions. First off, what if we used something other than occupation as our way of looking at within-party differences? Maybe occupation isn’t important but some other demographic is.
Second, are Britain’s cultural politics really best measured by the old-school questions on the death penalty, respect for British values, censoring movies etc, which are the standard we have used for decades but also feel like they might fit better with a 1980s Mary Whitehouse view of social attitudes? As a reminder, here’s what they are:
Young people today don’t have enough respect for traditional British values
For some crimes, the death penalty is the most appropriate sentence
Schools should teach children to obey authority
Censorship of films and magazines is necessary to uphold moral standards
People who break the law should be given stiffer sentences
Note these questions, while ‘timeless’, don’t include immigration, the environment, or discrimination against various groups - the defining cultural questions of the past decade. So what happens if we use those instead?
We’ll start with the cultural dimension I’ve used in the previous two posts and look at different demographics. Recall this cultural dimension is created using a single factor built largely off these five questions above.1 So the graphs here are directly comparable to the figure above that used occupation as our demographic of choice. Throughout all the figures in today’s post, the x-axis is the ‘economic dimension’ made up largely out of the following questions, combined in a single factor:
Government should redistribute income from the better off to those who are less well off
Big business takes advantage of ordinary people
Ordinary working people do not get their fair share of the nation’s wealth
There is one law for the rich and one for the poor
Management will always try to get the better of employees if it gets the chance
Different Demographics
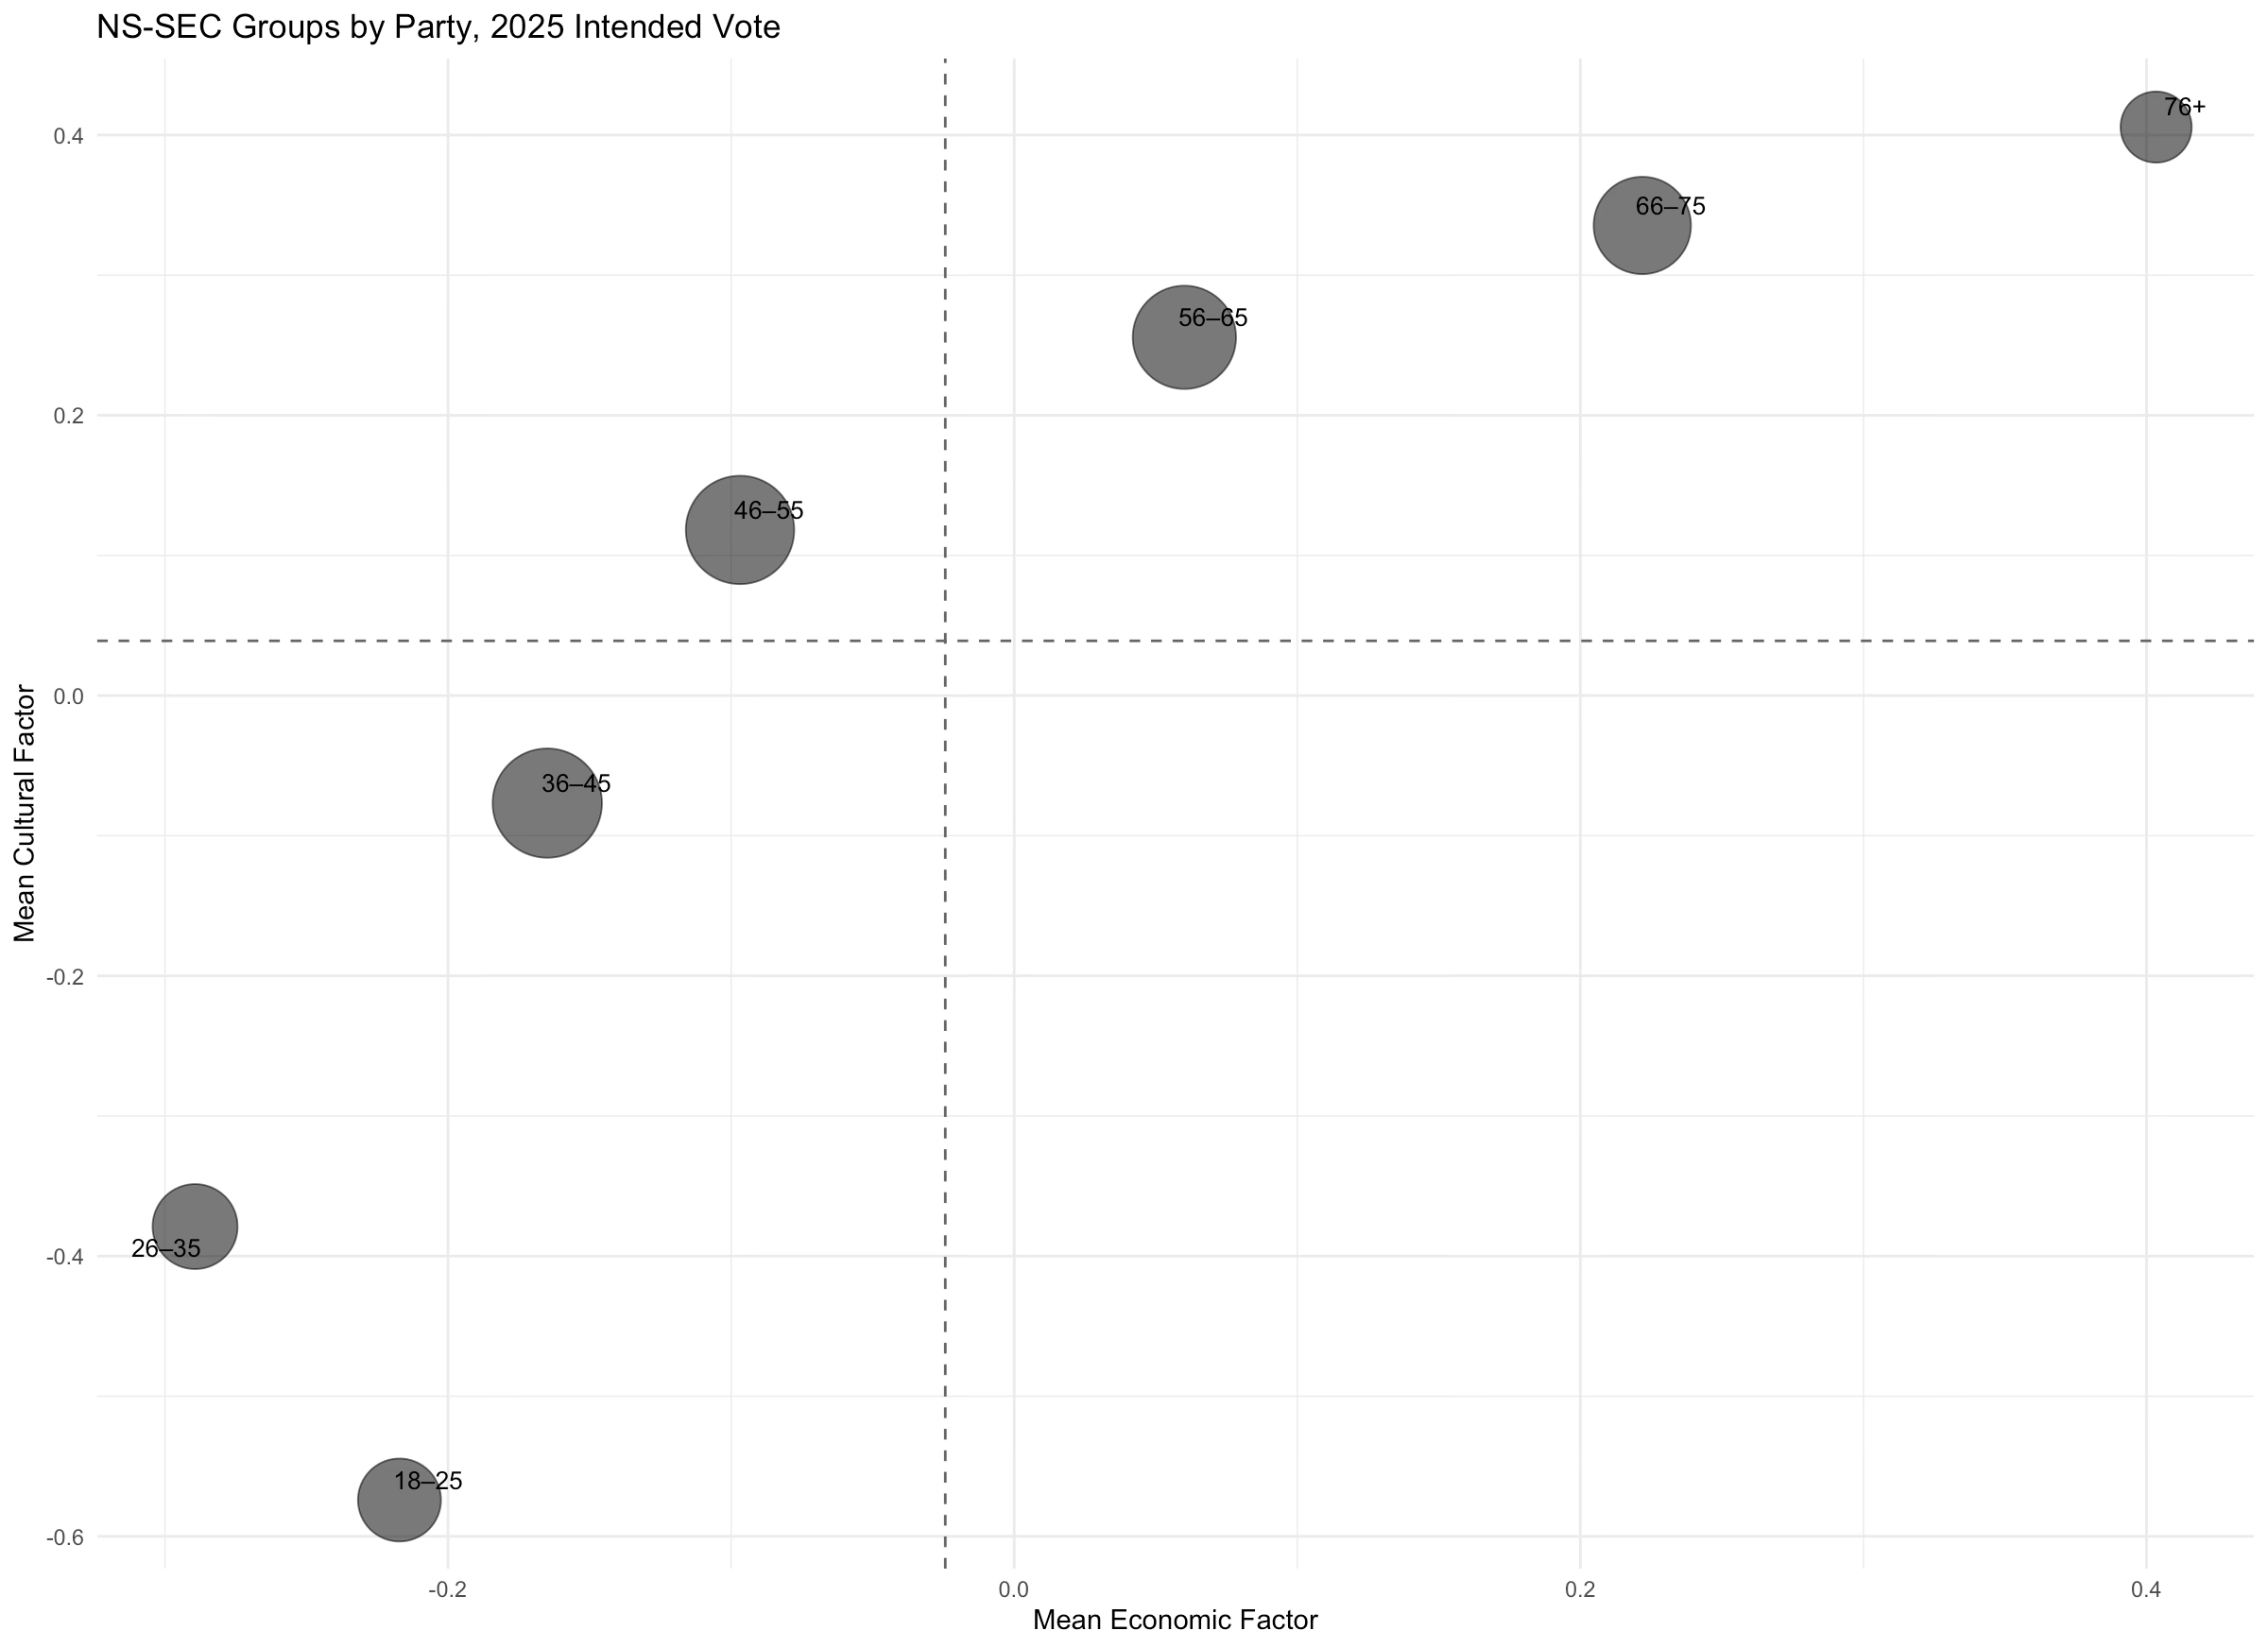
Enough throat-clearing. Let’s begin with a demographic that I think we all intuit must matter in British politics: age. I’ve divided age into seven groups (18-25, 26-35, 36-45, 46-55, 56-65, 66-75, and 76 plus). These aren’t quite equal sized, as you will see below, but they aren’t too far off, and we have over 30,000 observations in this wave of the BES, so we have several thousand people in each category.
Here are the average economic and cultural attitudes for each age group. It’s almost perfectly monotonic on both dimensions (curse you 18-25 for being more economically conservative than the 26-35 crew). Each age group is more culturally conservative than the group younger than them, and almost always (caveat noted above) more economically conservative. Since older people vote more, this might help explain the general consensus that Britain is a ‘centre-right country’. But it’s also helpful to see that all of this “the youth are tired of woke” is probably truer among the select group of young people who write op-eds for Unherd of the The Telegraph than of the rest of their slightly bemused peers.
Now, here’s the ‘famous’ bubble plot but split by age rather than occupation. And here what we see is three key things. First, parties matter more than age. Second, and related, the age composition of parties is quite different. Third, within each party (except maybe Labour) there is some variation driven by age in the manner you’d expect from the graph above. Older people in each party are more socially and economically conservative; there are more old people relative to young people in the Conservatives and (less so) Reform than the Greens and Labour; and the parties are still pretty clustered regardless of age.
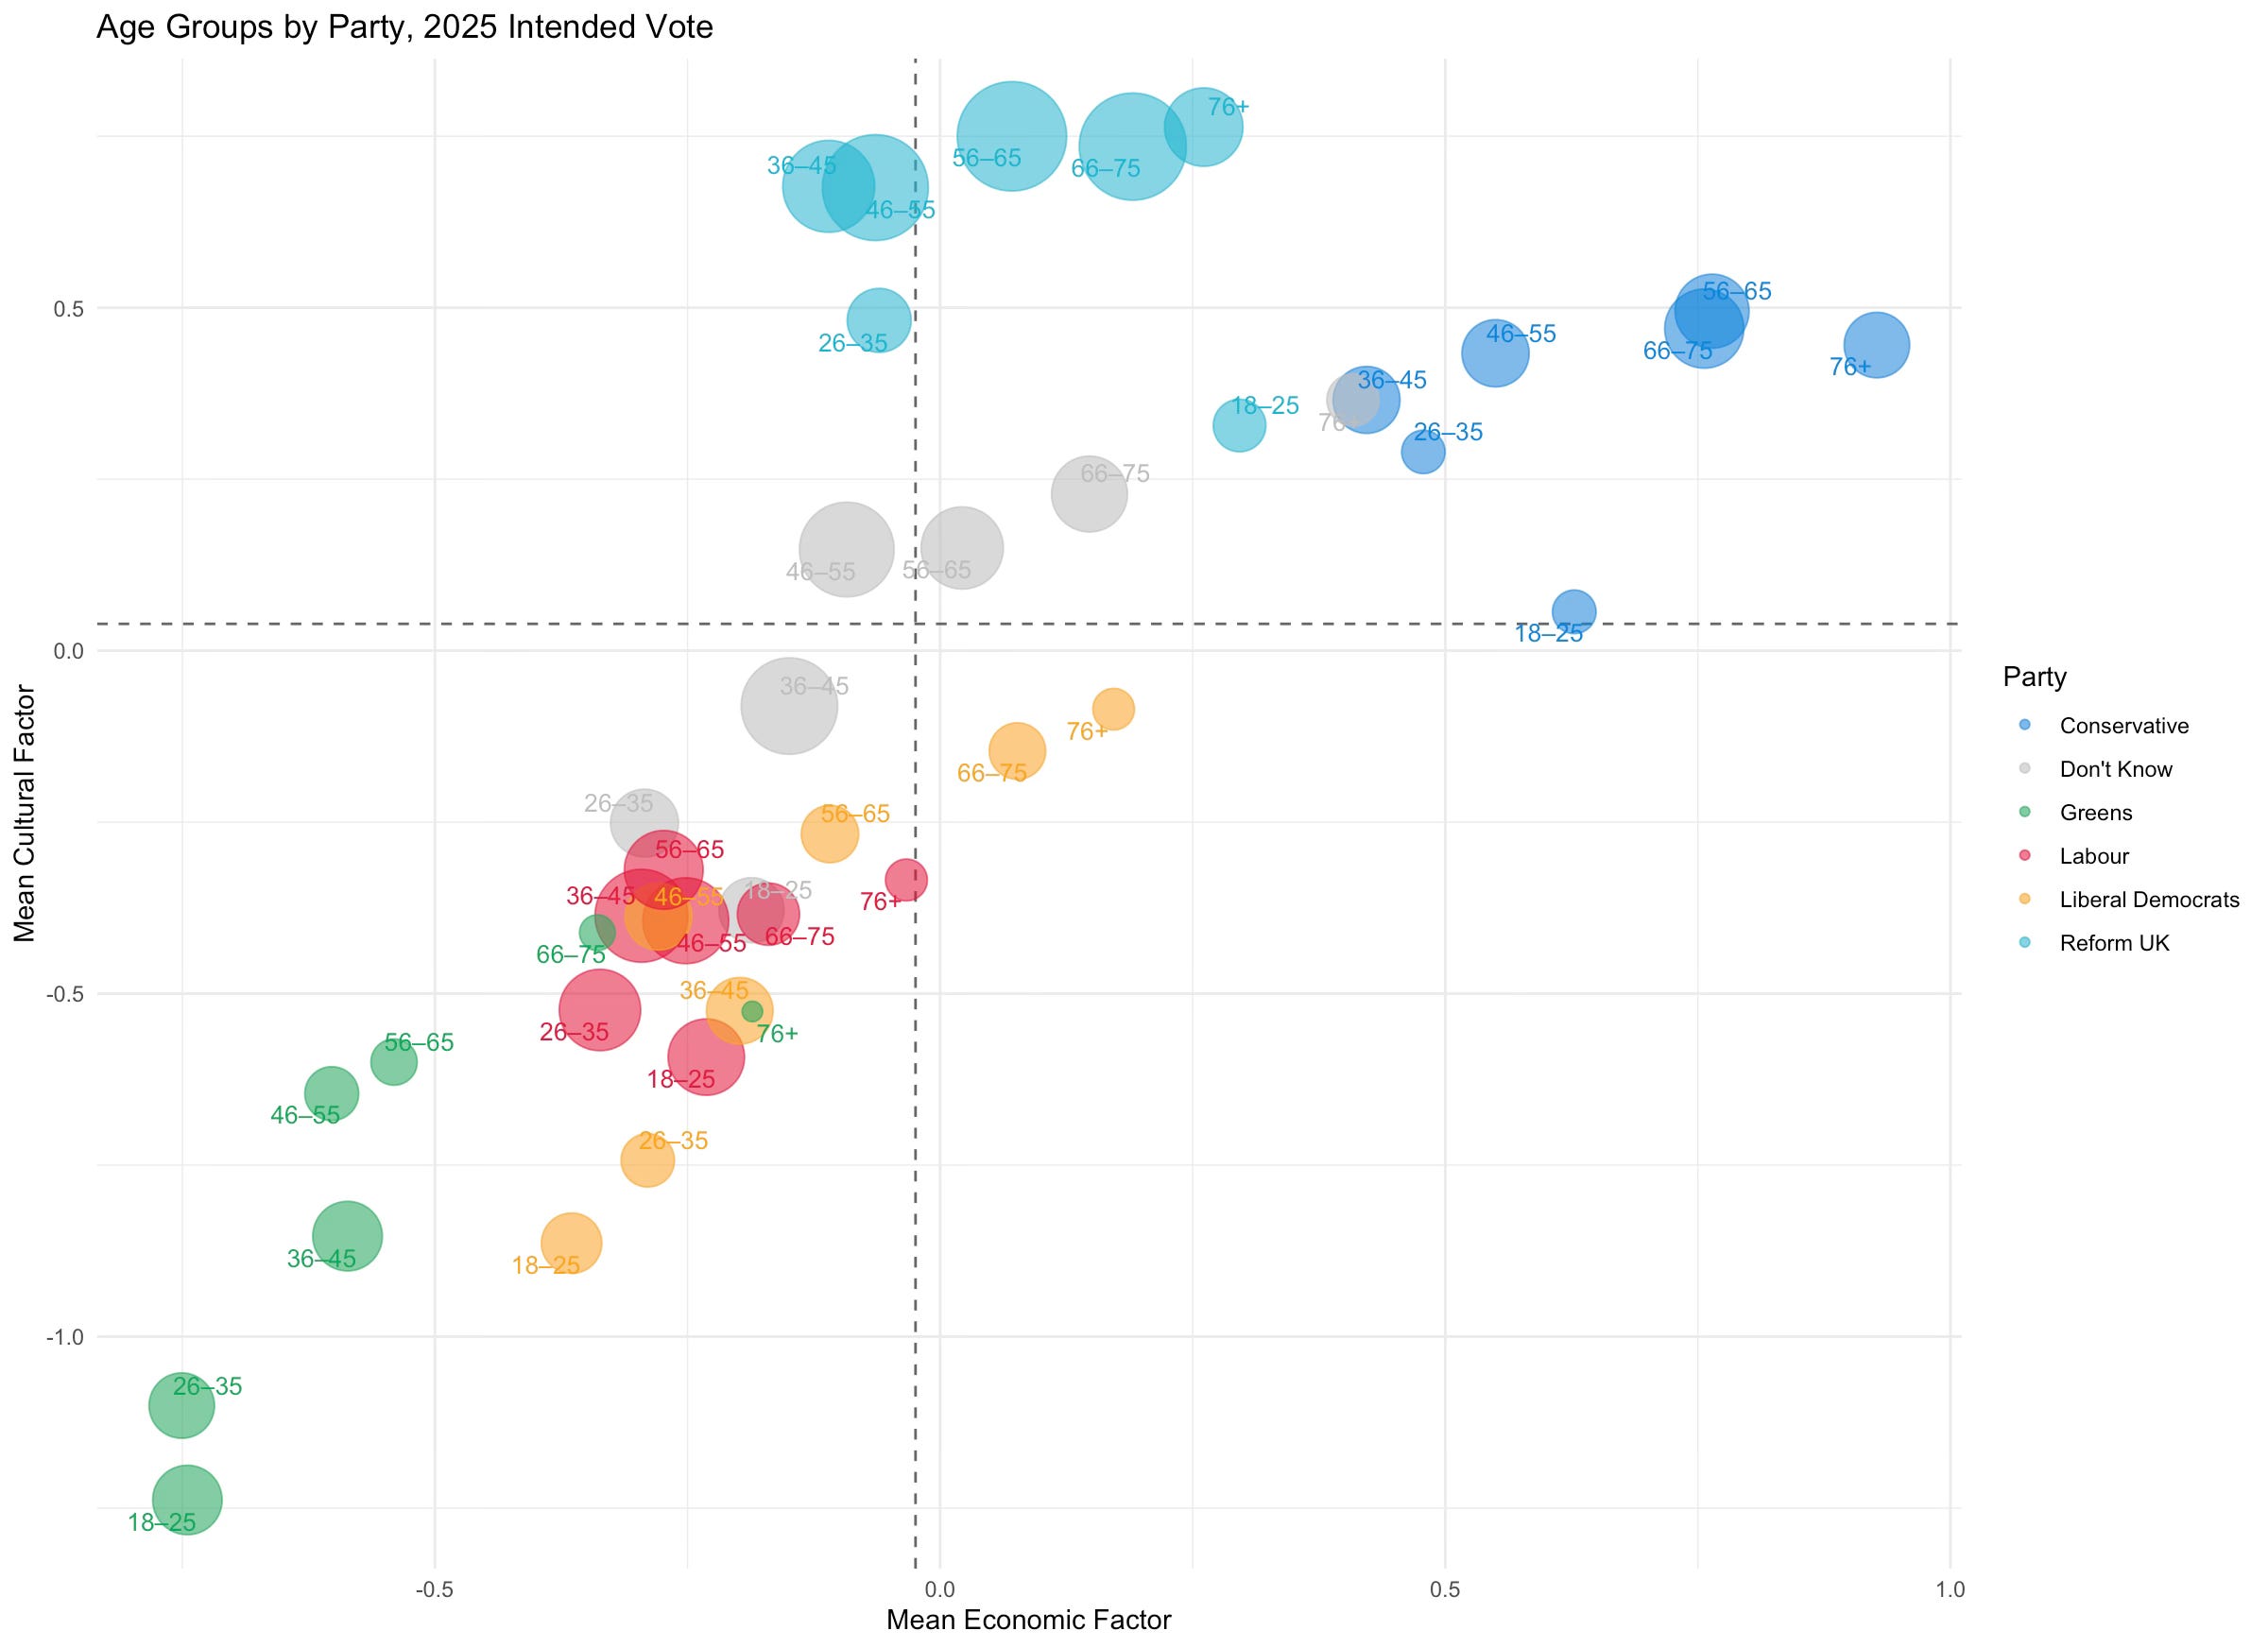
I wouldn’t read too much into it but there are a couple of interesting outliers - 18-25s for Reform and Conservatives are much less socially conservative than their older peers. And 18-25 year old Reform fans are more economically conservative than all other Reform voters, which does make me wonder if these are people who would quite recently have joined the Young Conservatives.
Finally, congratulations to 18-25 Green voters and 75 plus Conservatives - you are furthest from the middle of British politics. A ‘Dining Across the Divide’ Guardian article awaits you. If you can find something both of you would eat.
The other interesting group are Don’t Knows, whose are structure follows the usual conservatism with age pattern. But the younger ones (under 45) look to me like displaced Labour and Lib Dem voters. The older ones (46 to 75) are swing voters, and the 76 plus are basically Conservative voters.
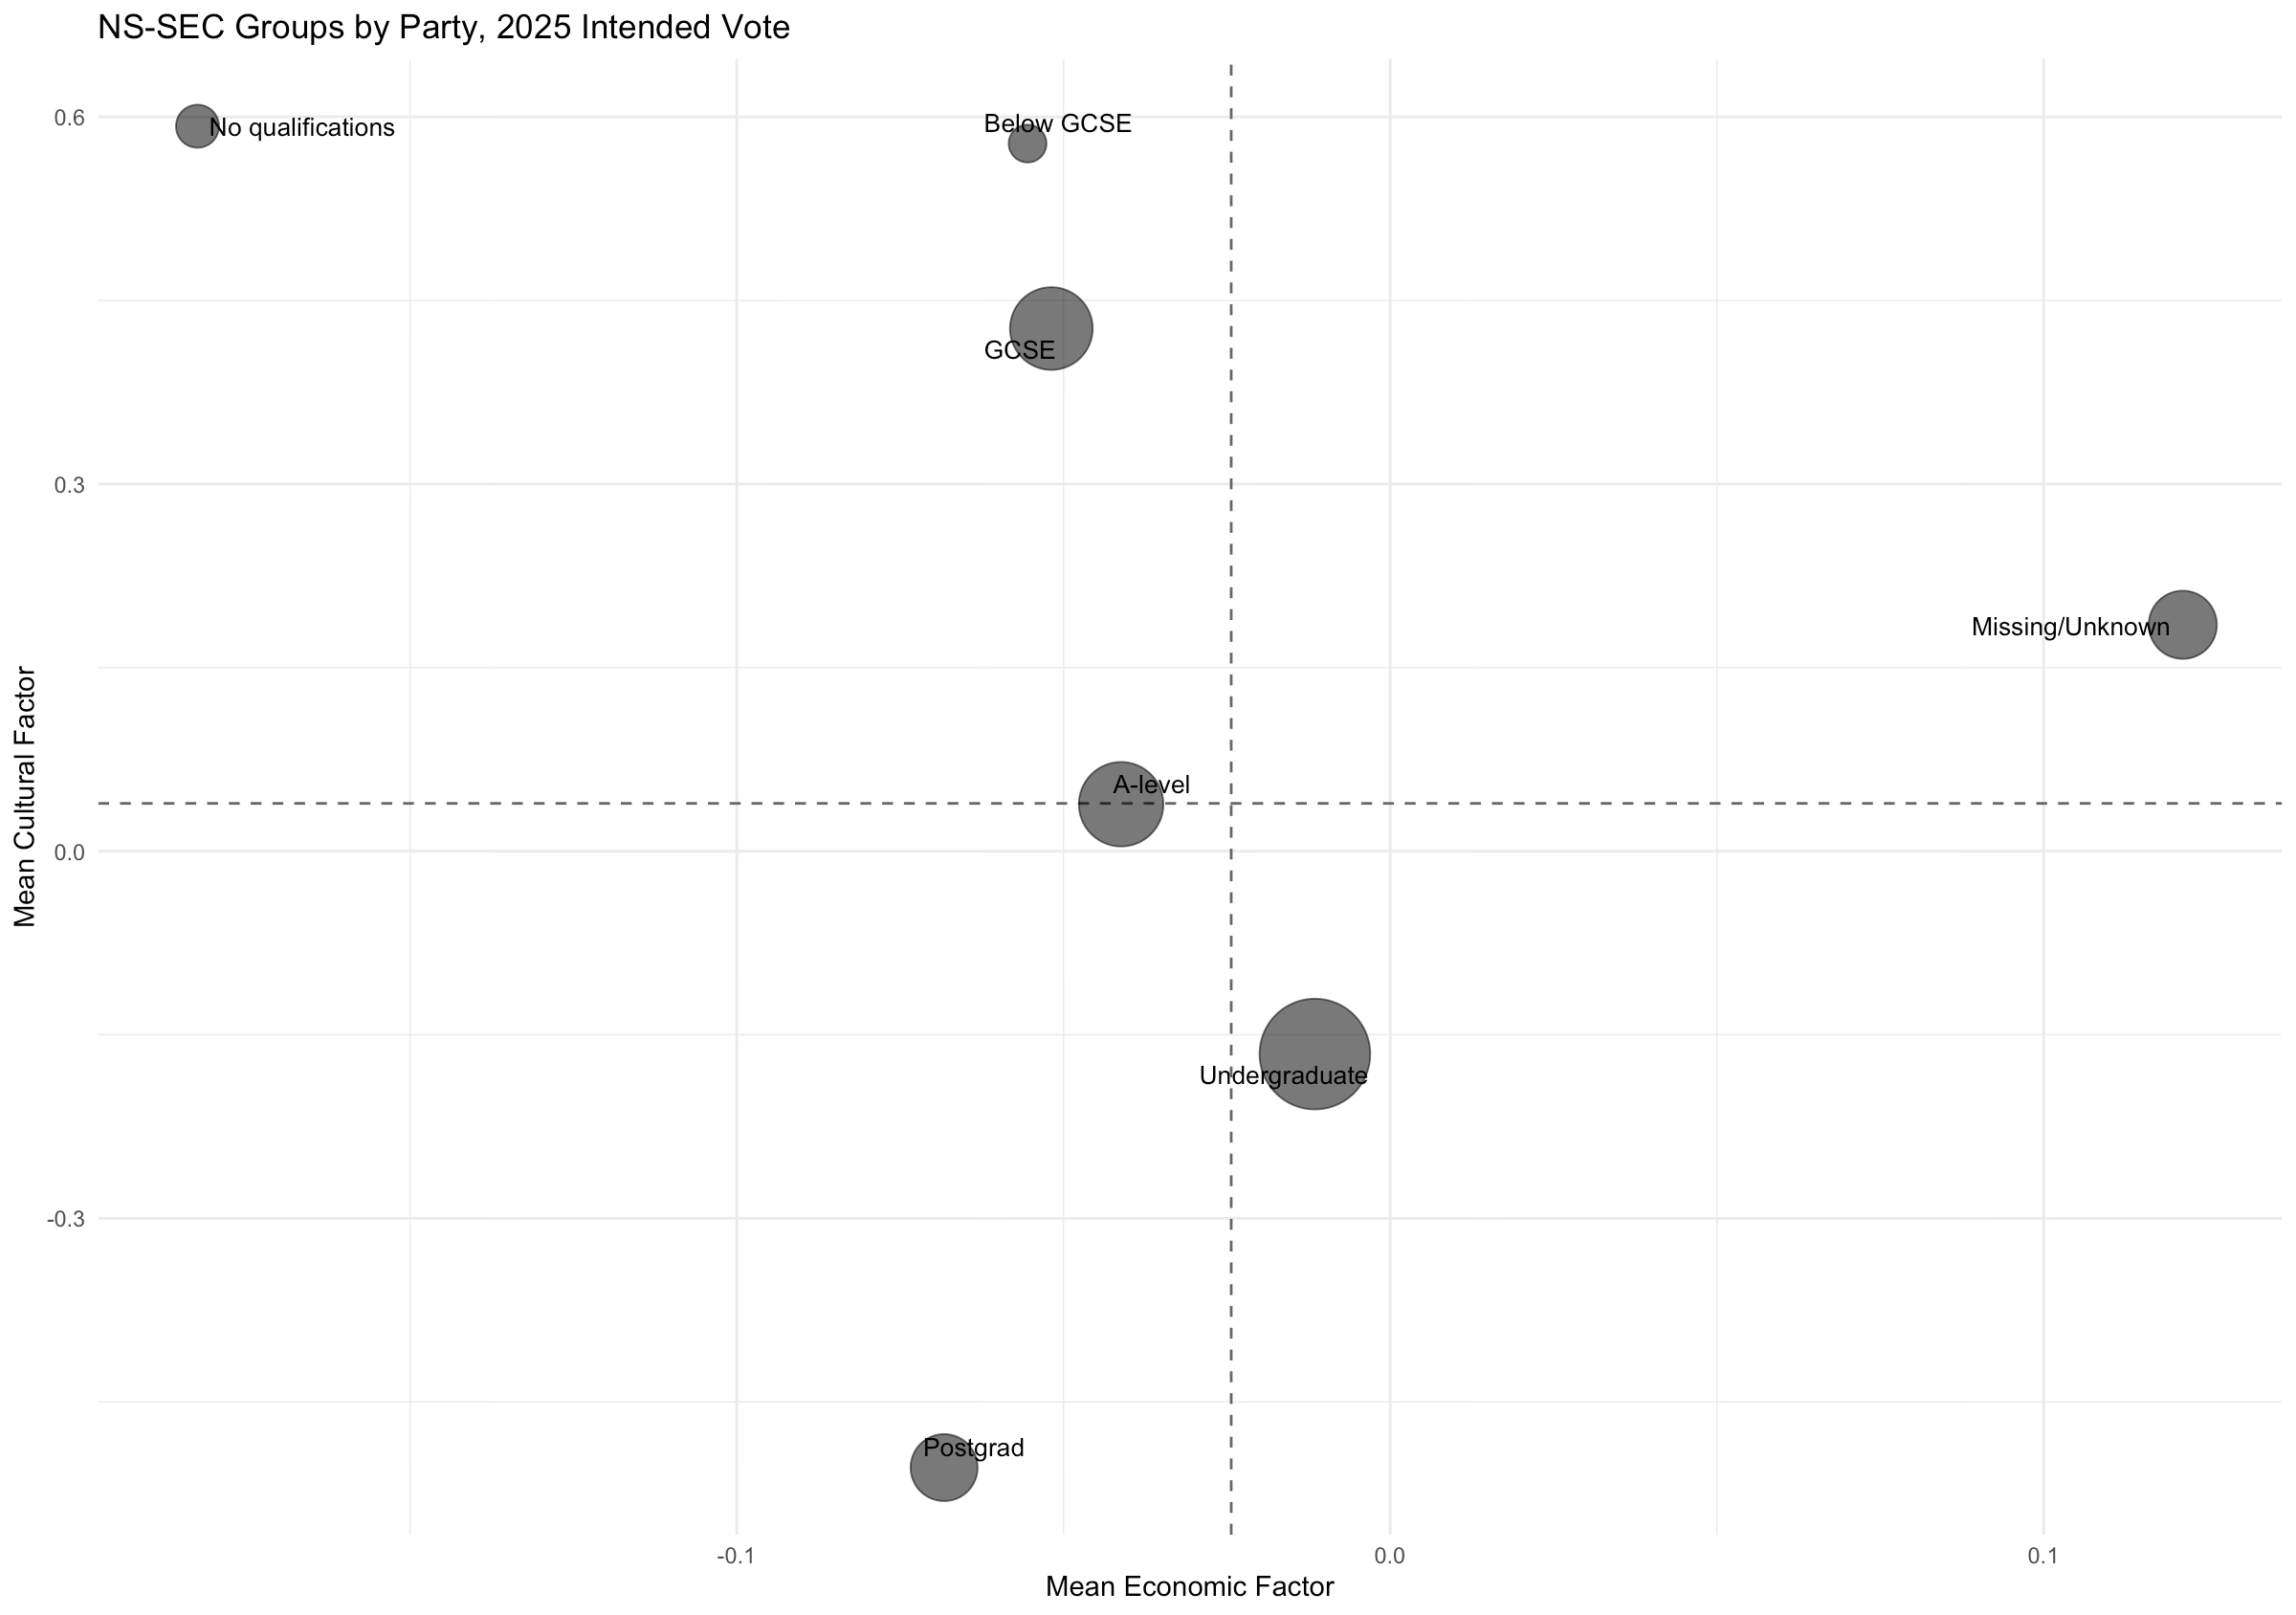
OK, onto the next demographic that we think matters in British politics - education. Here I use the BES’s code and also include data for the people who don’t provide their education (missing/unknown). Ignoring that outlier group, we get a very clear pattern of social liberalism increasing in education. Doubtless much of this also relates to age, given that younger people tend to have higher educational qualifications. Nonetheless, given how highly correlated education is with income, it is striking how little education predicts attitudes on the economic dimension. It’s culture all the way down.
Again, we can split this out by party. When we do so, again we see that party remains our best predictor. Voters still largely cluster in non-overlapping groups, except as before with Labour and Lib Dem voters (the torrid affair that dare not speak its name).
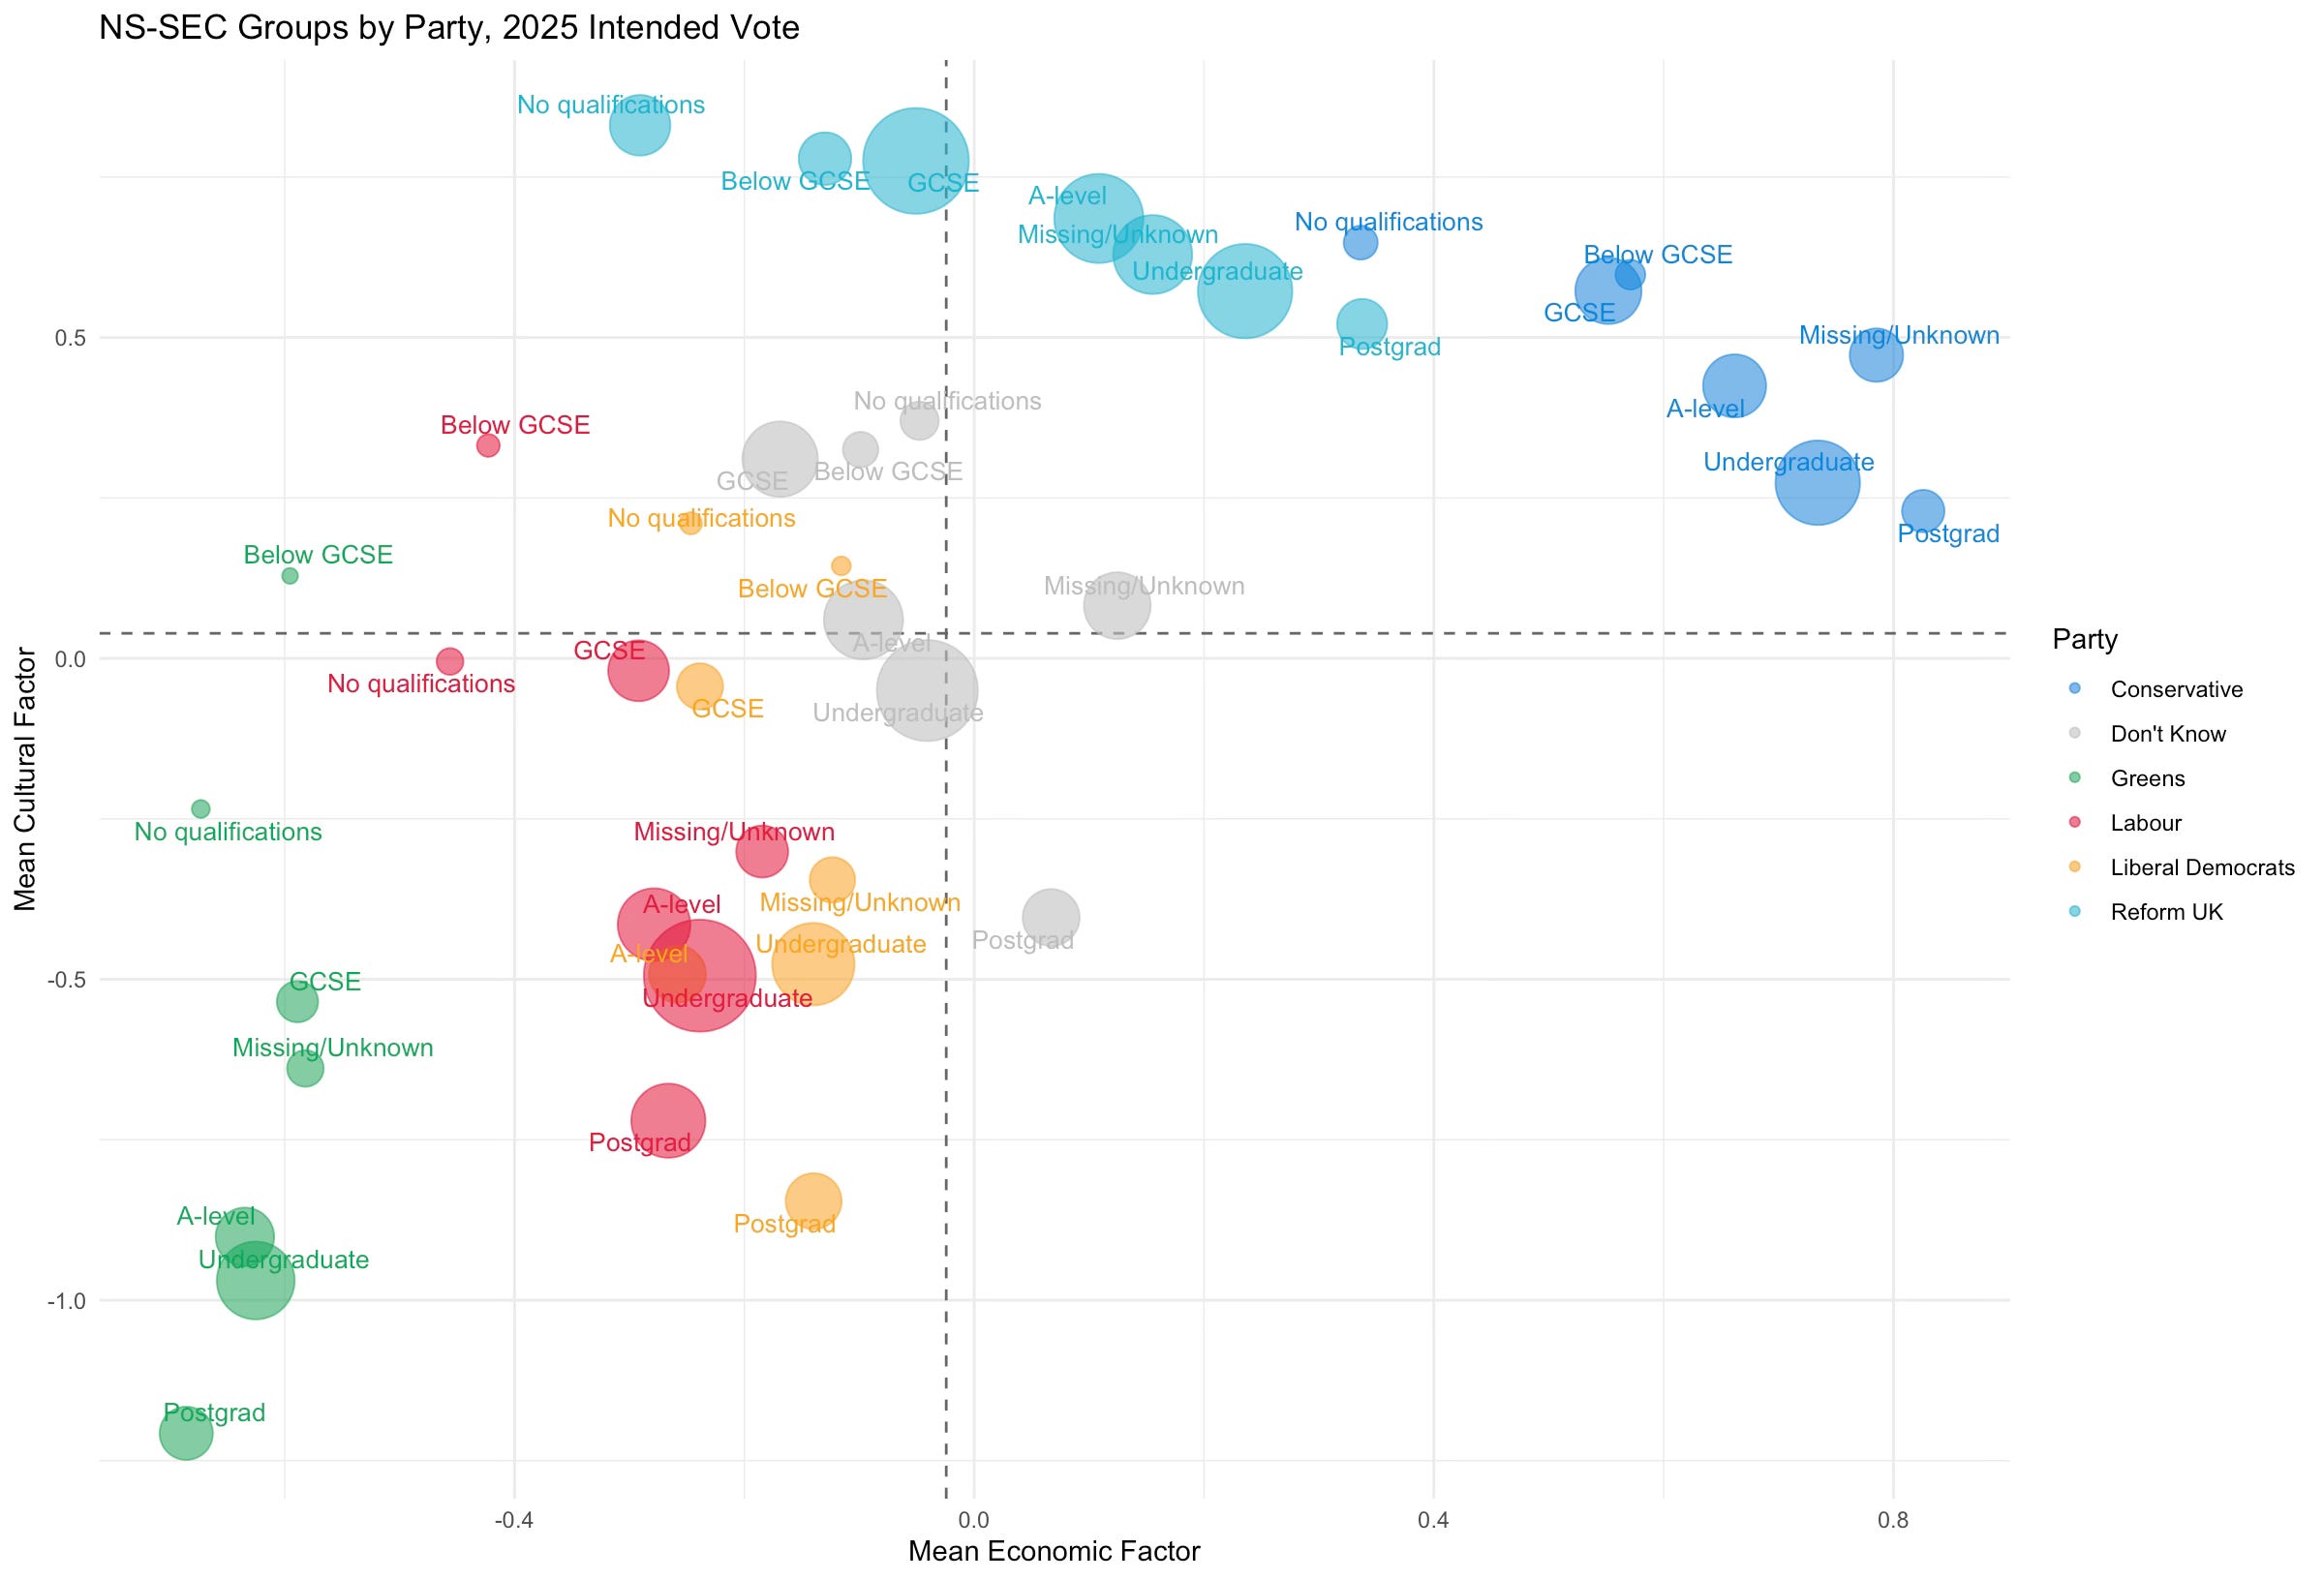
But there is something else going on that’s quite interesting here. The educational divide on Britain’s left is ‘vertical’ - that is, lower education groups are more socially conservative than their co-voters with higher educational qualifications. This is also broadly true among Don’t Knows, which makes me intuit they might be more like Labour/ Lib Dem / Green voters than right-wingers.
By contrast, right-wing voters have an education divide that is more ‘horizontal’ - their voters with higher education are more economically conservative. There is still a slope among this group too - higher education voters are more socially liberal. But it’s the economic divide that dominates.
What does this mean? Tricky to know completely - definitely that the risks to the two right wing parties are making any economic commitments that might split apart their voters - though it’s easy to be out of office and not really have to do that. They have greater internal alignment on social issues, which are also easy to hammer on about when in opposition. So maybe that helps explain some of today’s politics.
Contemporary Culture Clashes
But you know what would really help explain today’s politics? Using measures of cultural attitudes that more closely match the kind of fights we have in today’s media and politics rather than those of the 1980s. Nothing you will see below makes me doubt what we found in the previous posts because old-school cultural attitudes and new-school ones are highly correlated. But there are some really interesting quirks for us to look at. And in particular they will tell us something especially interesting about people who are attracted to Reform…
I am going to go back to the occupational groups I’ve used in the last two posts. I hope I have convinced you in the earlier parts of this post that they are not misleading and that ultimately party matters a lot more than demographics. And so I hope you will forgive me for returning to these categories, because that’s what I made the graphs for.
Let’s start with a fairly simple if increasingly ferocious culture war - immigration. It has been, errr surprising, that the current Labour Party’s immigration policy is significantly to the right of that offered by the last fourteen years of Conservative government. Remembering the era of David Blunkett I suppose I shouldn’t be surprised. But still, reneging on the settlement rules that recent migrants came to the UK under leaves a very bad taste in my mouth. You may disagree but please do feel free to read my lengthy views on immigration policy from a few months ago. Clearly Blue Labour didn’t…
Anyway, we are where we are - perfidious Albion and all that - so how do British voters split on immigration and will Labour voters be happy with Mahmood’s draconian new rules?
No, I suspect they won’t. Reform voters will be though. And as we know, those remain, to paraphrase F Scott Fitzgerald, the blinking teal light across the bay. The unattainable dream. Let’s have a look, shall we?
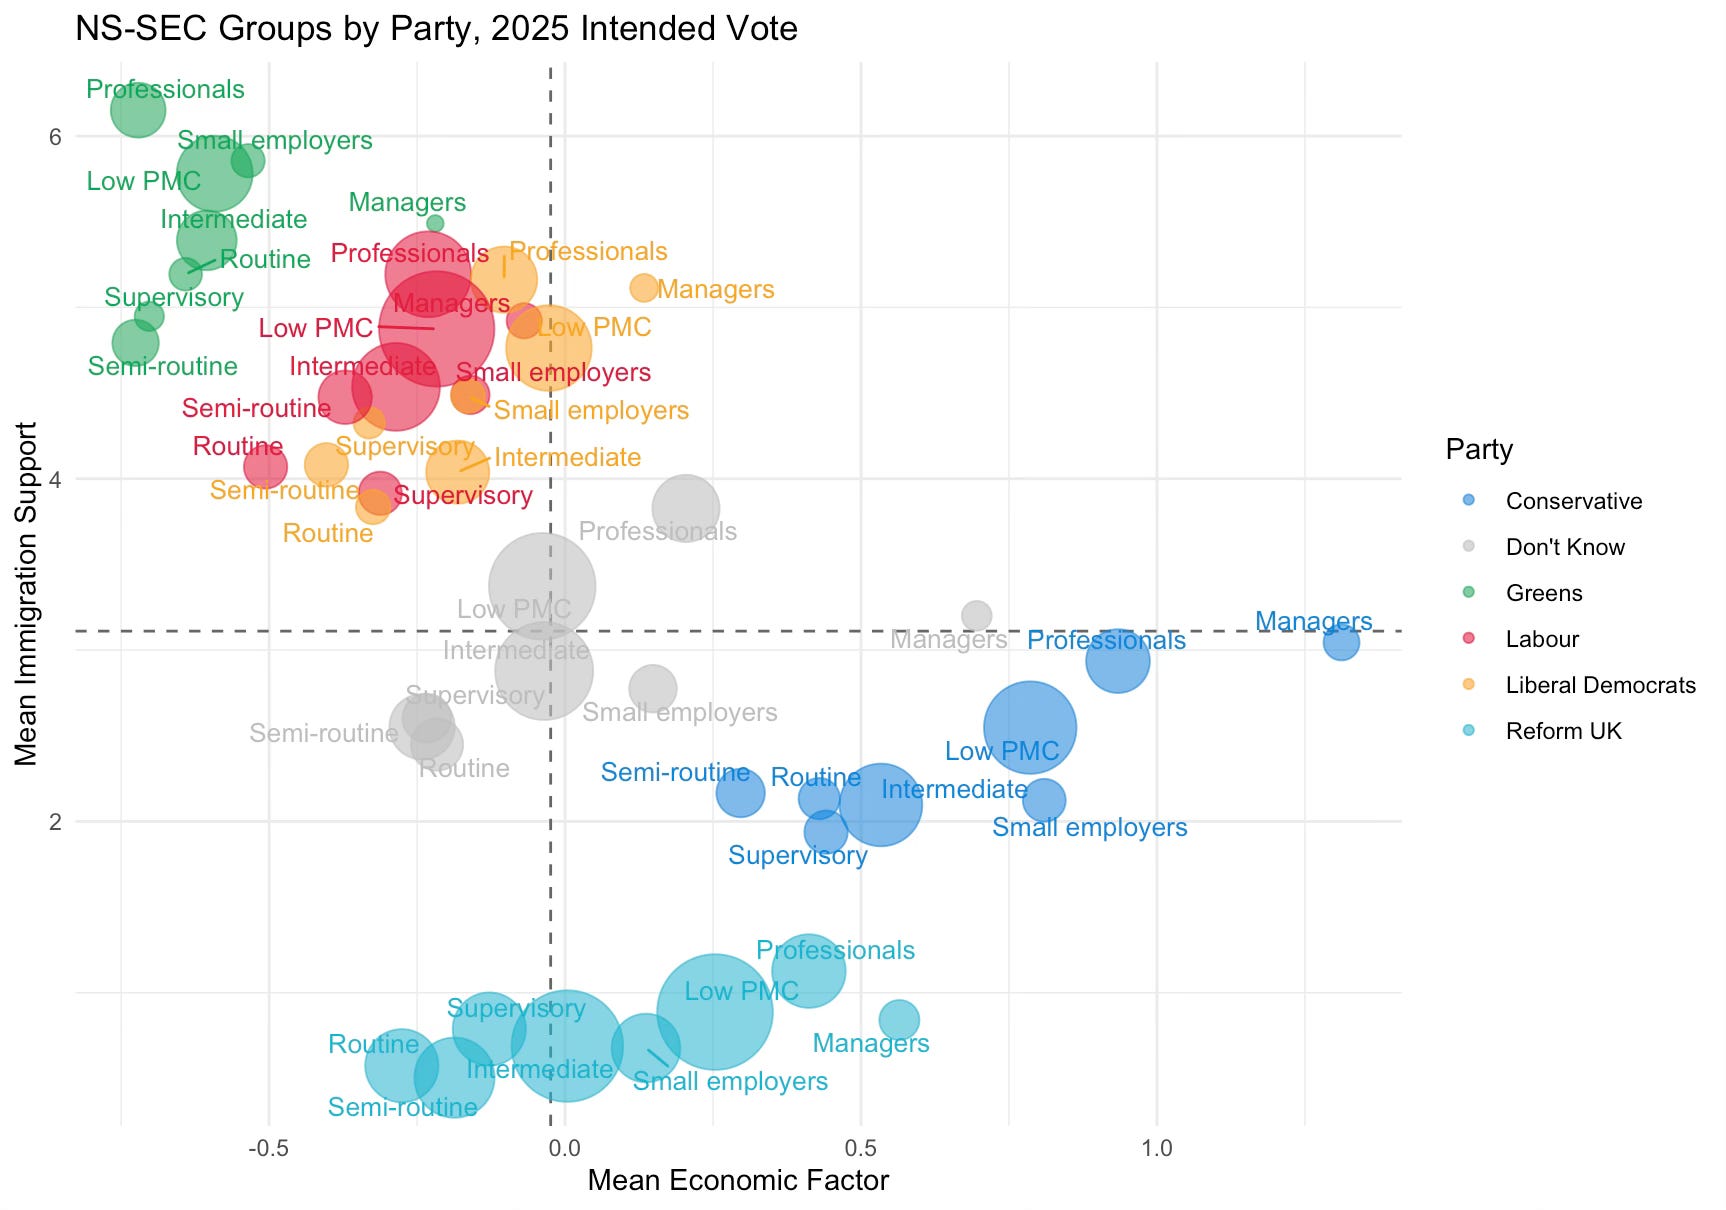
I am starting by looking at the BES question on whether in the respondent’s view Britain should let in many fewer immigrants (zero) through to many more (ten). You will not be surprised to hear - if you read my previous posts on public opinion about immigration - that the average score is just over three. On the whole, people do indeed want lower immigration (or did in May 2025). So to that extent, Labour’s recent white paper makes sense - I’m not mad, I do understand the politics, even if I think the reneging on entry conditions part is very shabby.
Immigration attitudes tend to cluster at points on this scale - a LOT of people answer zero (about thirty percent). But there is another large cluster at five (almost twenty percent). These are the ‘basically fine, whatever’ people. And have a look at the graph below. They are the Labour Party and the Lib Dems. Greens are on average supportive of more immigrants coming (not entirely sure how they will reconcile that with standard Green views about building houses…).
Don’t knows cluster around the middle - just over 3. Conservatives, a little below the middle (between 2 and 3). And Reform voters? Yeah, they don’t like immigrants. Their average is well below one. I do have some grudging respect for the 16 people in the sample who intend to vote for Reform but also answered ten on the scale. Perhaps they got confused… Anyway hope they have fun with the 5,000+ respondents of their fellow party who answered zero.
As part of a continuing theme, Reform voters are the most obviously separate group on this issue. None of their bubbles overlaps with the immigration support of any bubble from any other party. Conservatives overlap a good deal with DKs and Labour. Lib Dems and Greens overlap a great deal (and a little with DKs).
We see very similar patterns if we look at other questions about immigration, including its economic and cultural impacts, so I won’t bore you with those graphs.
Instead let’s move on to the Woke Wars (TM). The British Election Study has an interesting battery of questions about discrimination against various groups. They ask people about six groups (Men, Women, White British people, Black and Asian people (BES call this BME), Gays and Lesbian people, and Transgender people). And the scale is again between zero and ten, with zero meaning a lot of discrimination in favour and ten meaning a lot of discrimination against.
As you know, I love a bit of factor analysis when I have a lot of similarish questions. So I will begin by combining these into a single ‘discrimination’ factor. For the nerds among you, here are the factor loadings:
Discrimination Against Gays and Lesbians 0.869
Discrimination Against White British -0.562
Discrimination Against Blacks and Asians (BME) 0.782
Discrimination Against Men -0.518
Discrimination Against Transgender People 0.893
Discrimination Against Women 0.493
So this goes as we would expect I think. Positive numbers are associated with traditionally ‘minoritised’ groups and negative numbers with ‘dominant’ groups. Bigger numbers on this discrimination factor are associated with thinking LGBT people, ethnic minorities and women are discriminated against and that men and White British people are discriminated in favour of.
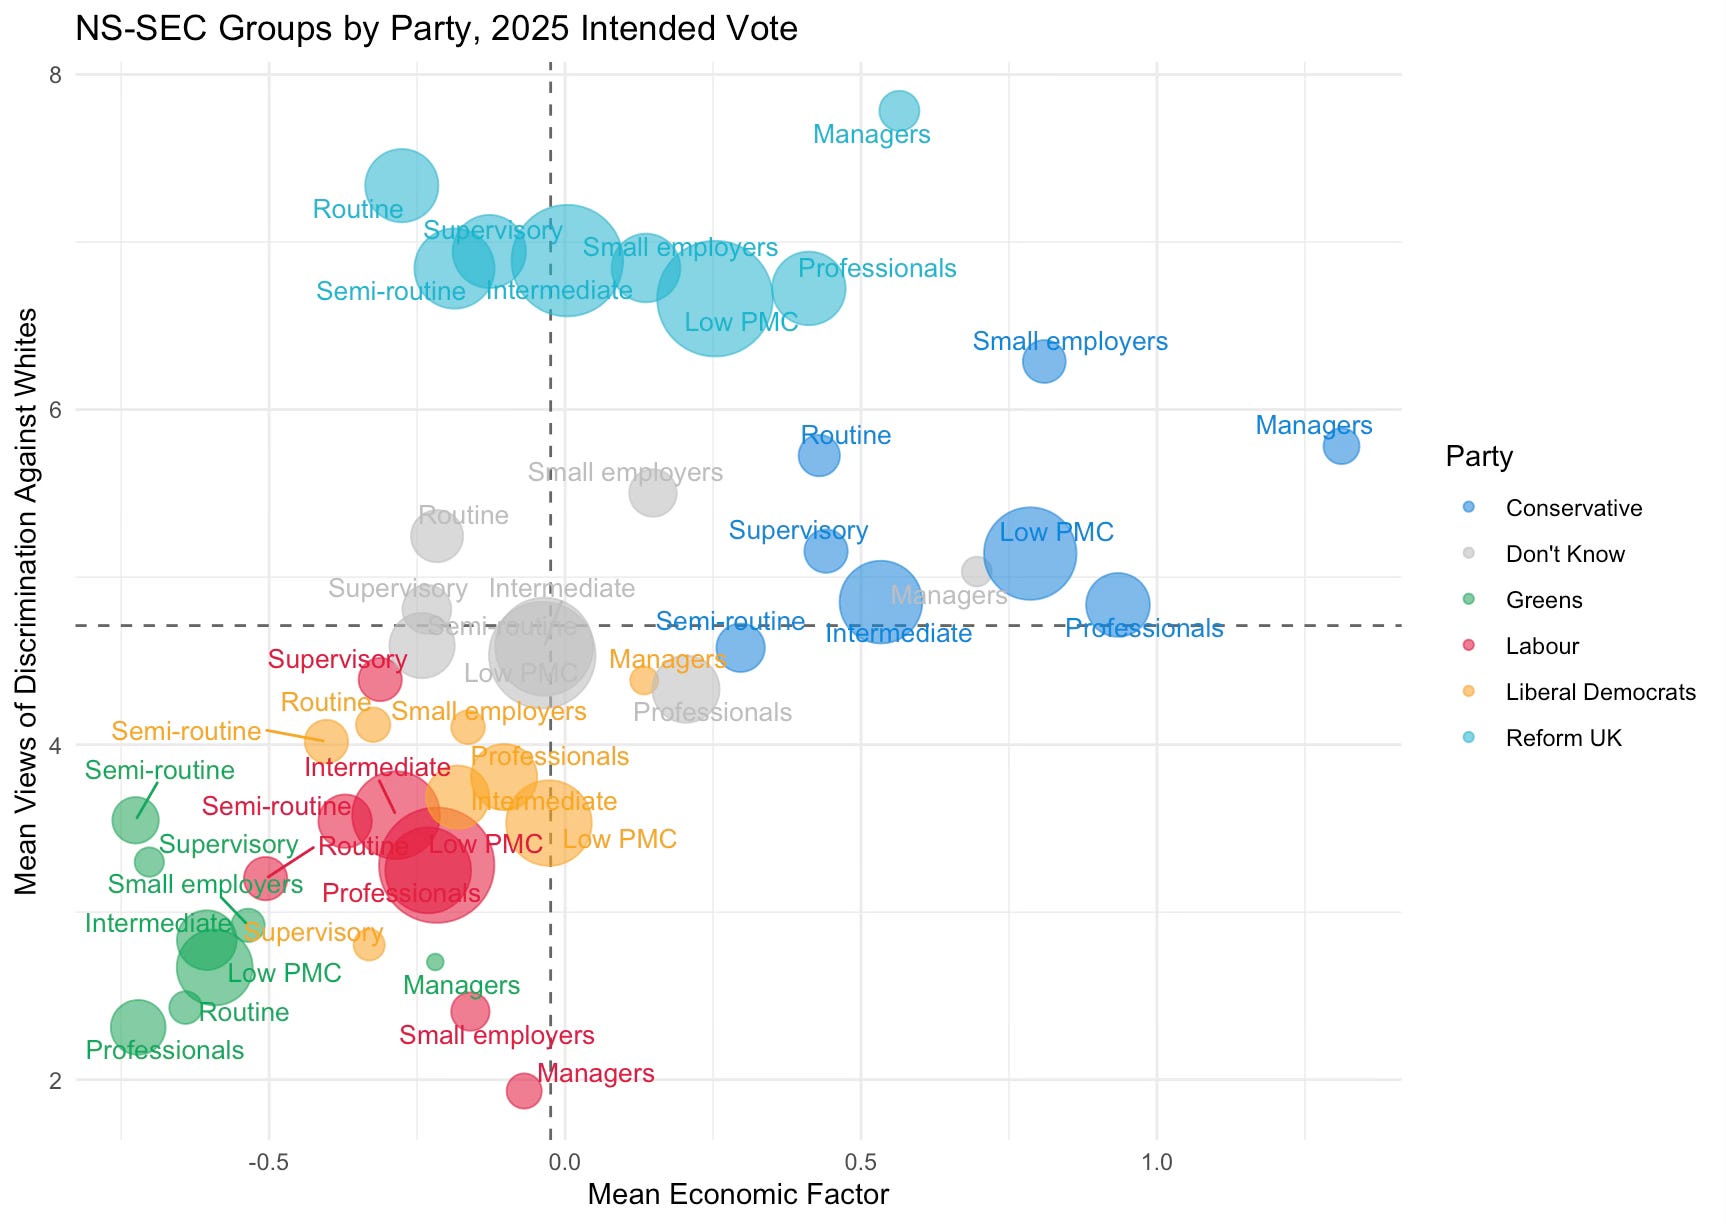
So how do the British public line up on this dimension? As we would expect I think. Again we keep the economic factor as the x-axis and we now have discrimination as the y-axis (with more ‘lefty liberal’ views being higher numbers).
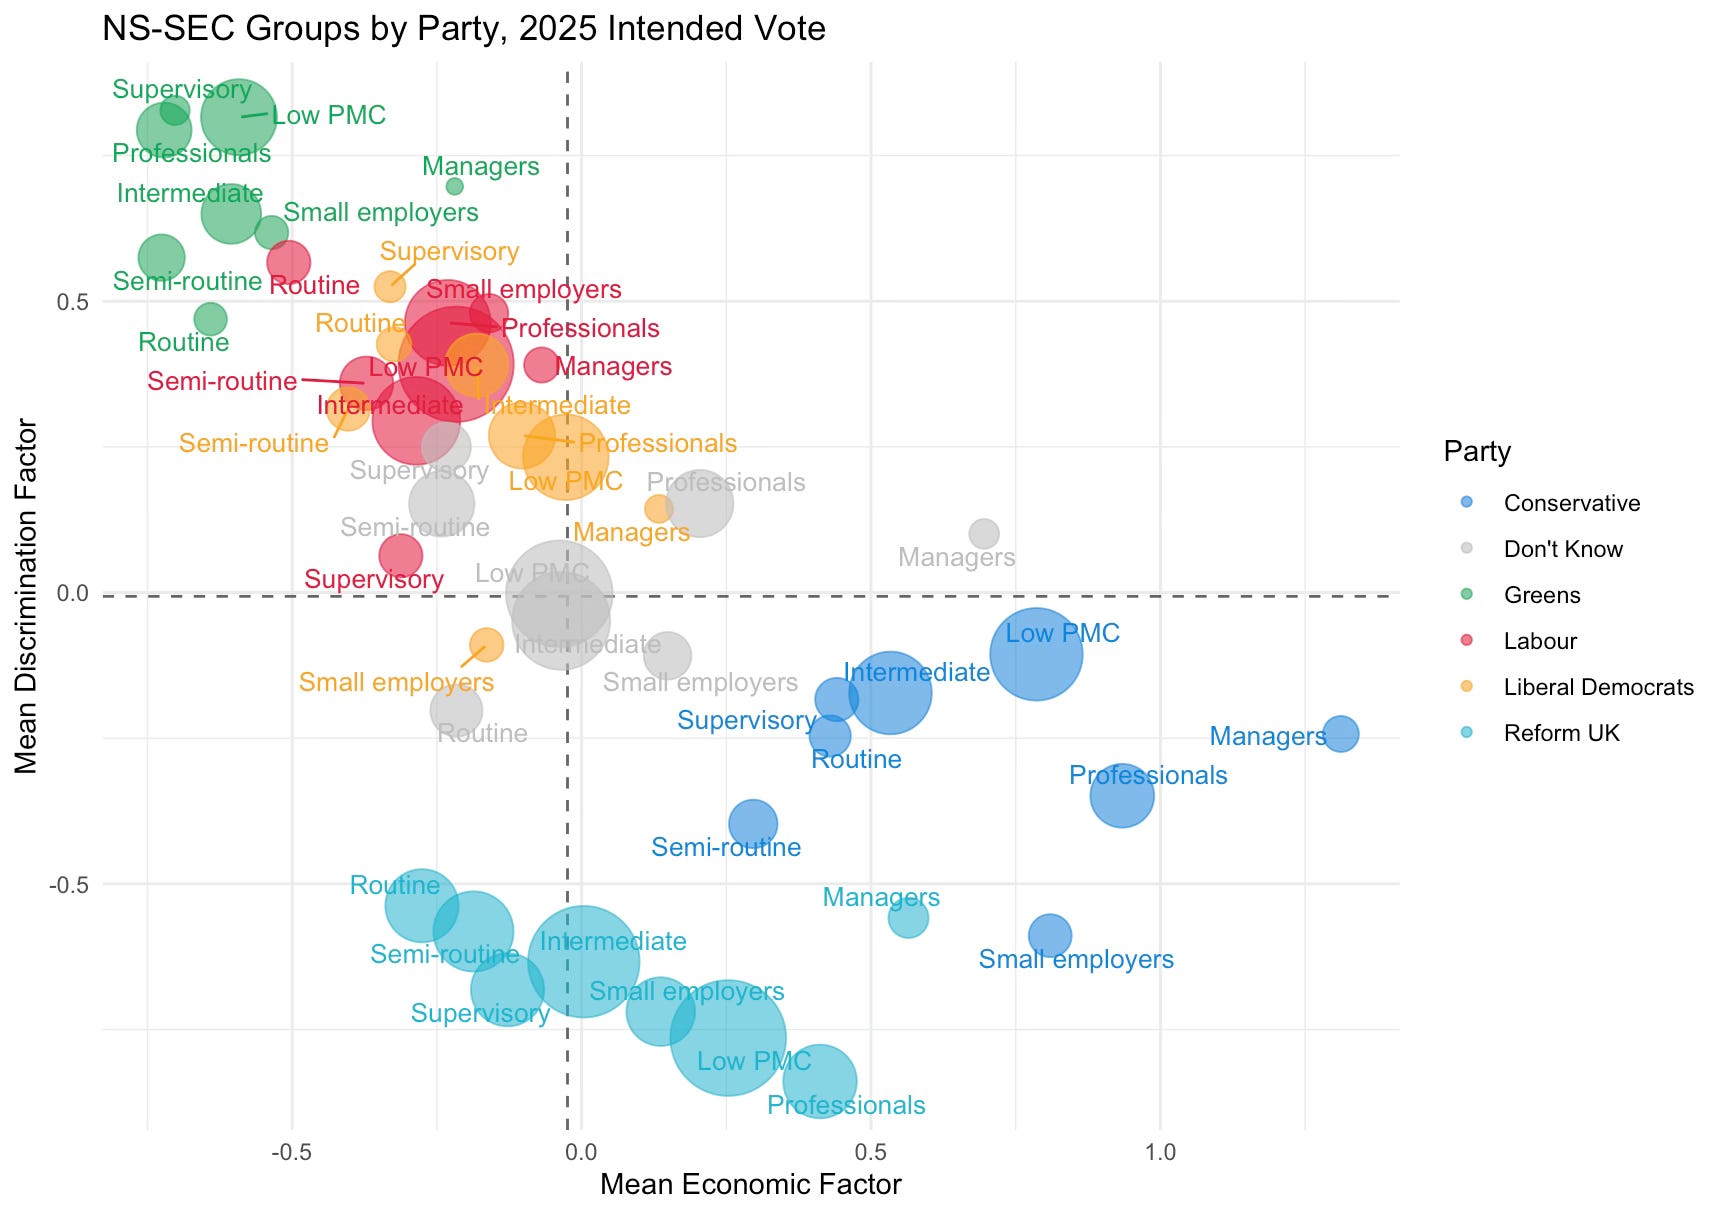
As usual we see lots of clustering among Labour and Lib Dem voters. Don’t Knows also look rather a lot like Lab, Lib voters. Green are more ‘woke’, Conservatives a little ‘anti-woke’. And Reform voters? They spit on woke. Especially, those who are professionals.
But we have six questions and you might expect some differences in how voters divide across them. And you would be right. In some cases Reform voters look like everyone else and in some they… um… very much do not.
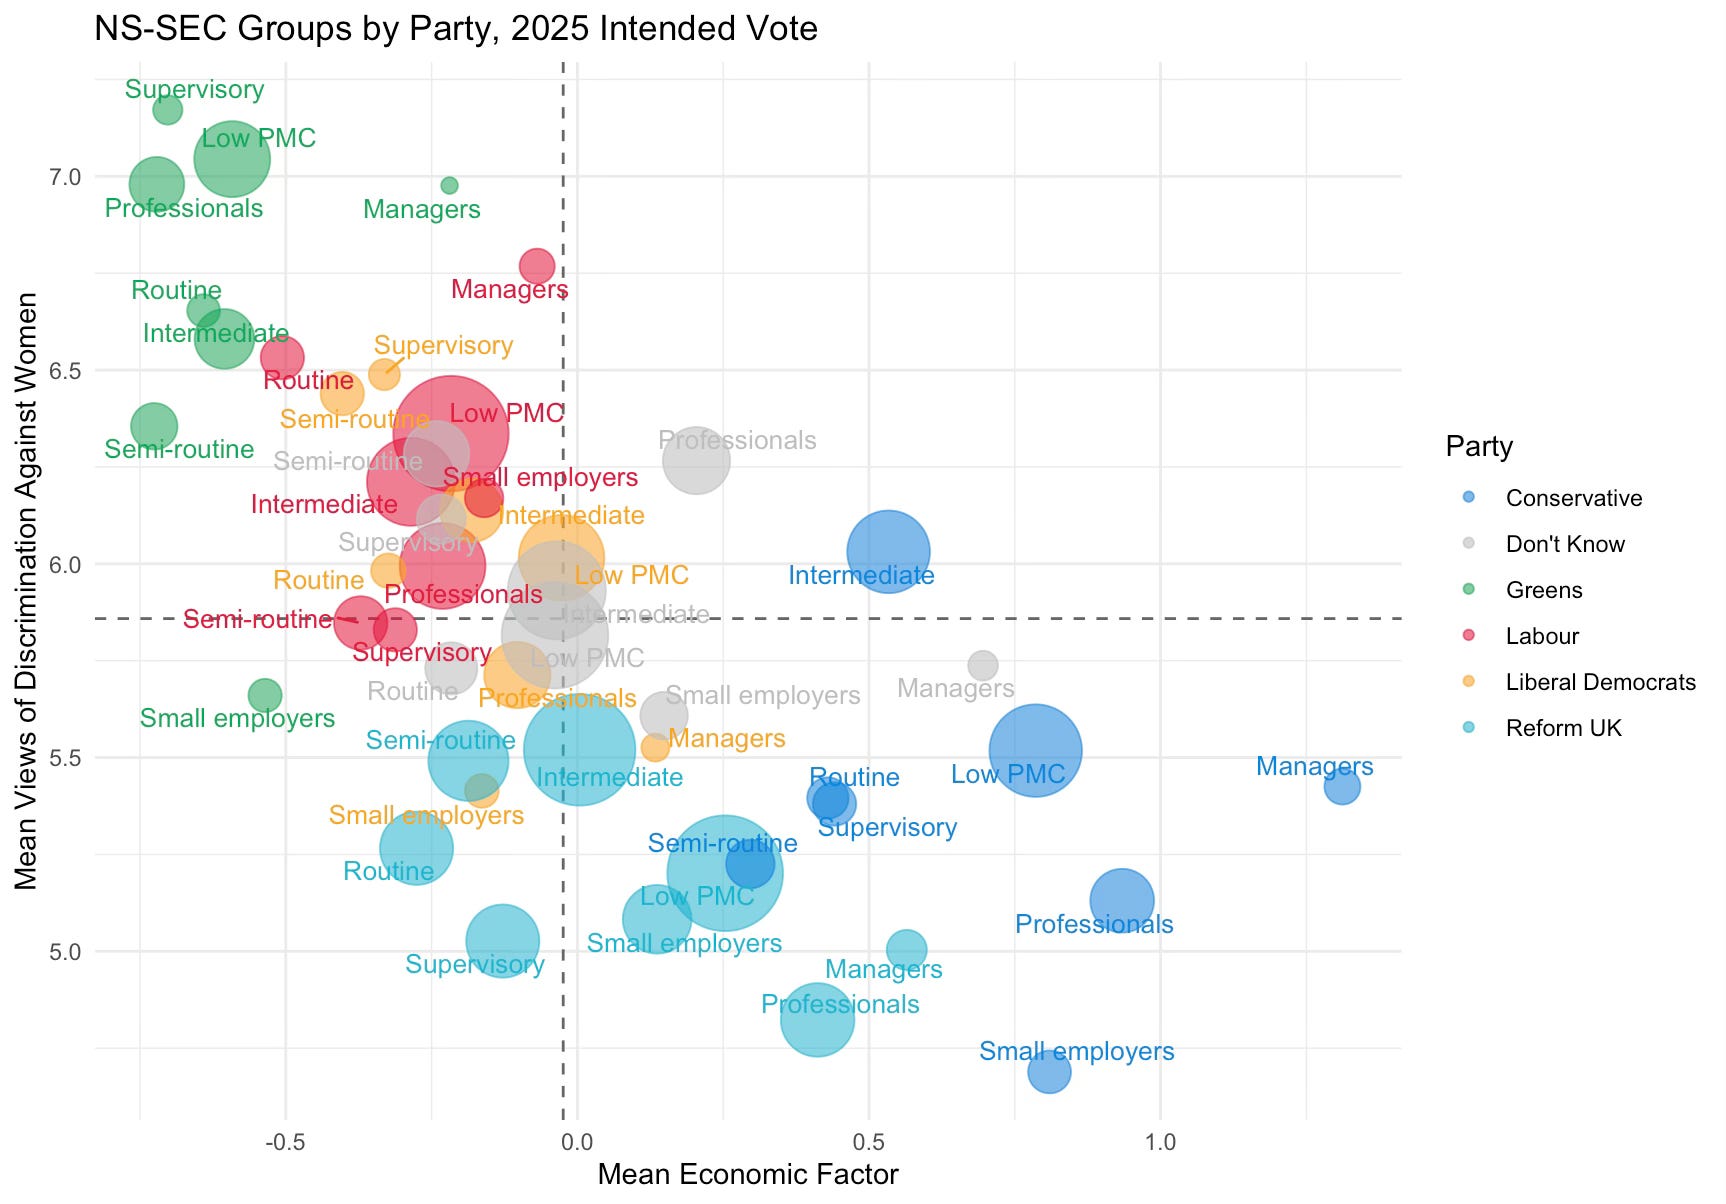
Here’s a case where there’s lots of overlap among voters of different parties - perceptions of discrimination against women. We have an average of almost six, so on average people think women are discriminated against. But note that Reform voters and Conservatives are somewhat less likely to think that and Greens substantially more. All said though, the parties differences aren’t enormous.
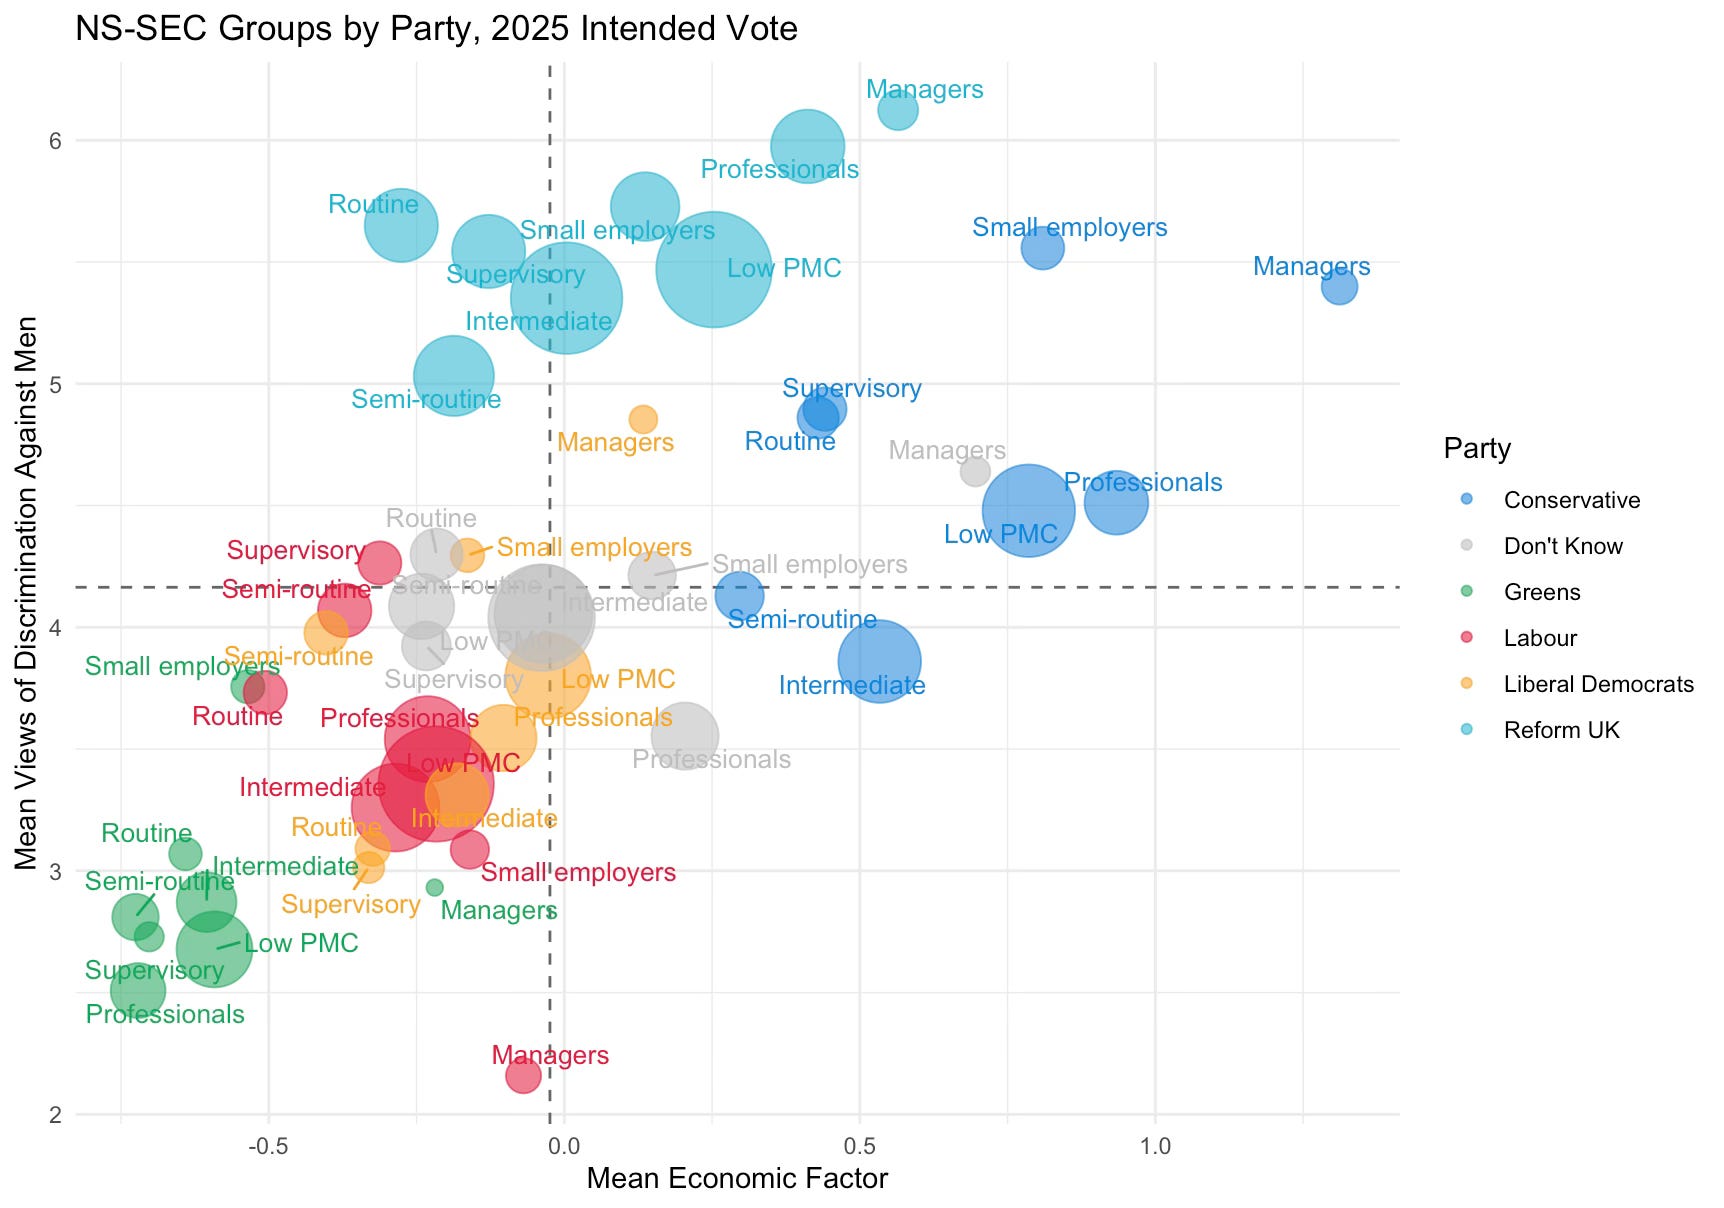
We get something rather more interesting if we look at discrimination for or against men. Here the average is just above four, so the British public as a whole think men experience positive rather than negative discrimination. But you know who don’t? Reform voters. Every group of Reform voters has an average of five or above - that is, they think men are discriminated against. That’s true for a couple of small groups of Conservative voters (small employers and managers) but not for anyone else. Indeed, Labour and Lib Dem and Don’t Knows are all in roughly the same zone here, along with a number of Conservatives. Greens… they definitely think men get a better deal.
Oh and one thing - the vertical axes are comparable so we can see who thinks men are more discriminated against than women. Who is that you ask? Reform professionals and managers and Conservative small employers. I’m sure you’ve met these guys down the golf club.
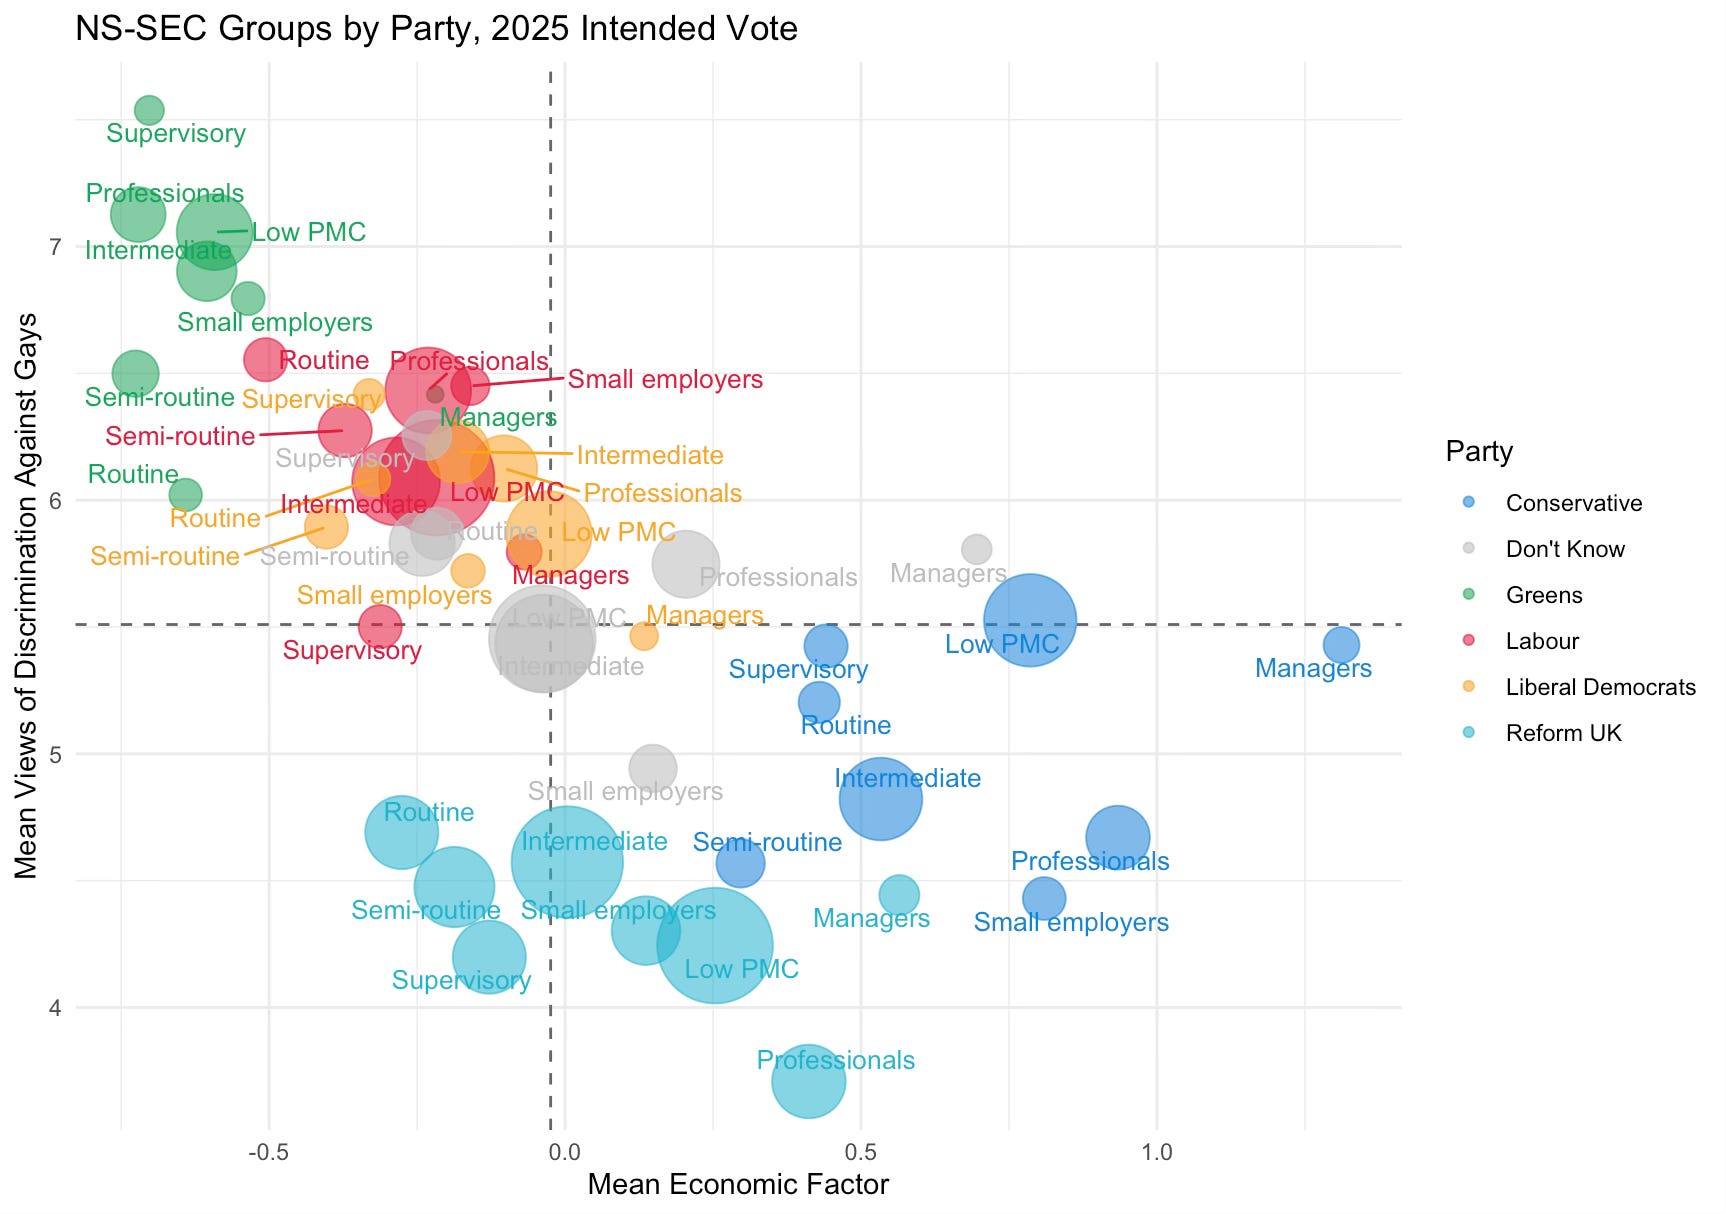
What about discrimination based on sexual identity? Below is discrimination against gays and lesbians, which has an average of 5.5 - very similar to discrimination against women. We see an overall similar partisan pattern as for discrimination against women too, but with a bit more separation among parties. In particular, Reform voters are clustering among the lowest - indeed, all Reform groups think gays and lesbians experience positive discrimination at the margin. Some Conservatives think similarly. Practically no-one else does. Especially not Greens.
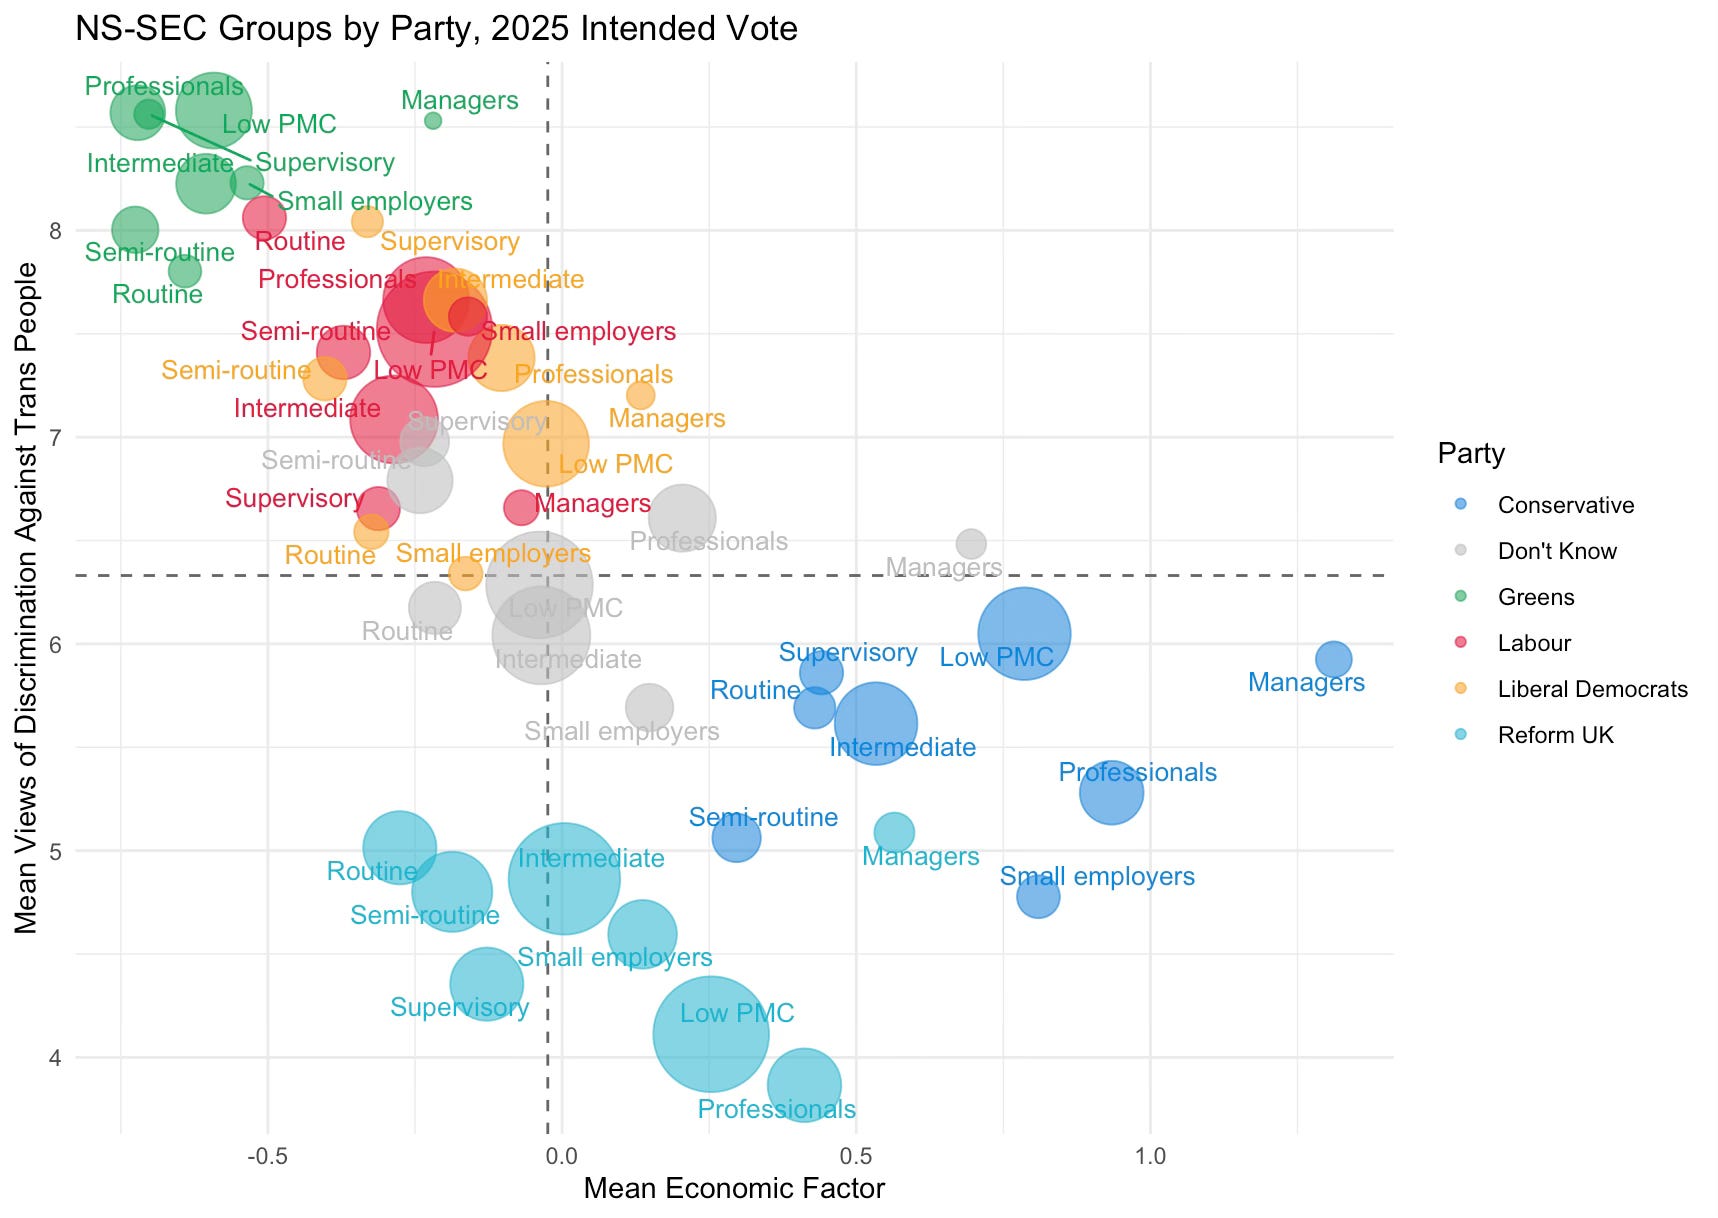
And what about transgender people? Most people think they are discriminated against - with an average of 6.5. This is the highest average among all the different groups we are looking at. The separation is even more obvious here, with the parties all lining up in order and with minimal overlap (largely confined to Labour, Lib Dems and Don’t Knows, as usual). Reform voters are separating out from Conservatives again and in every case except managers and routine, all occupational groups among Reform voters think transgender people experience positive discrimination in their favour.
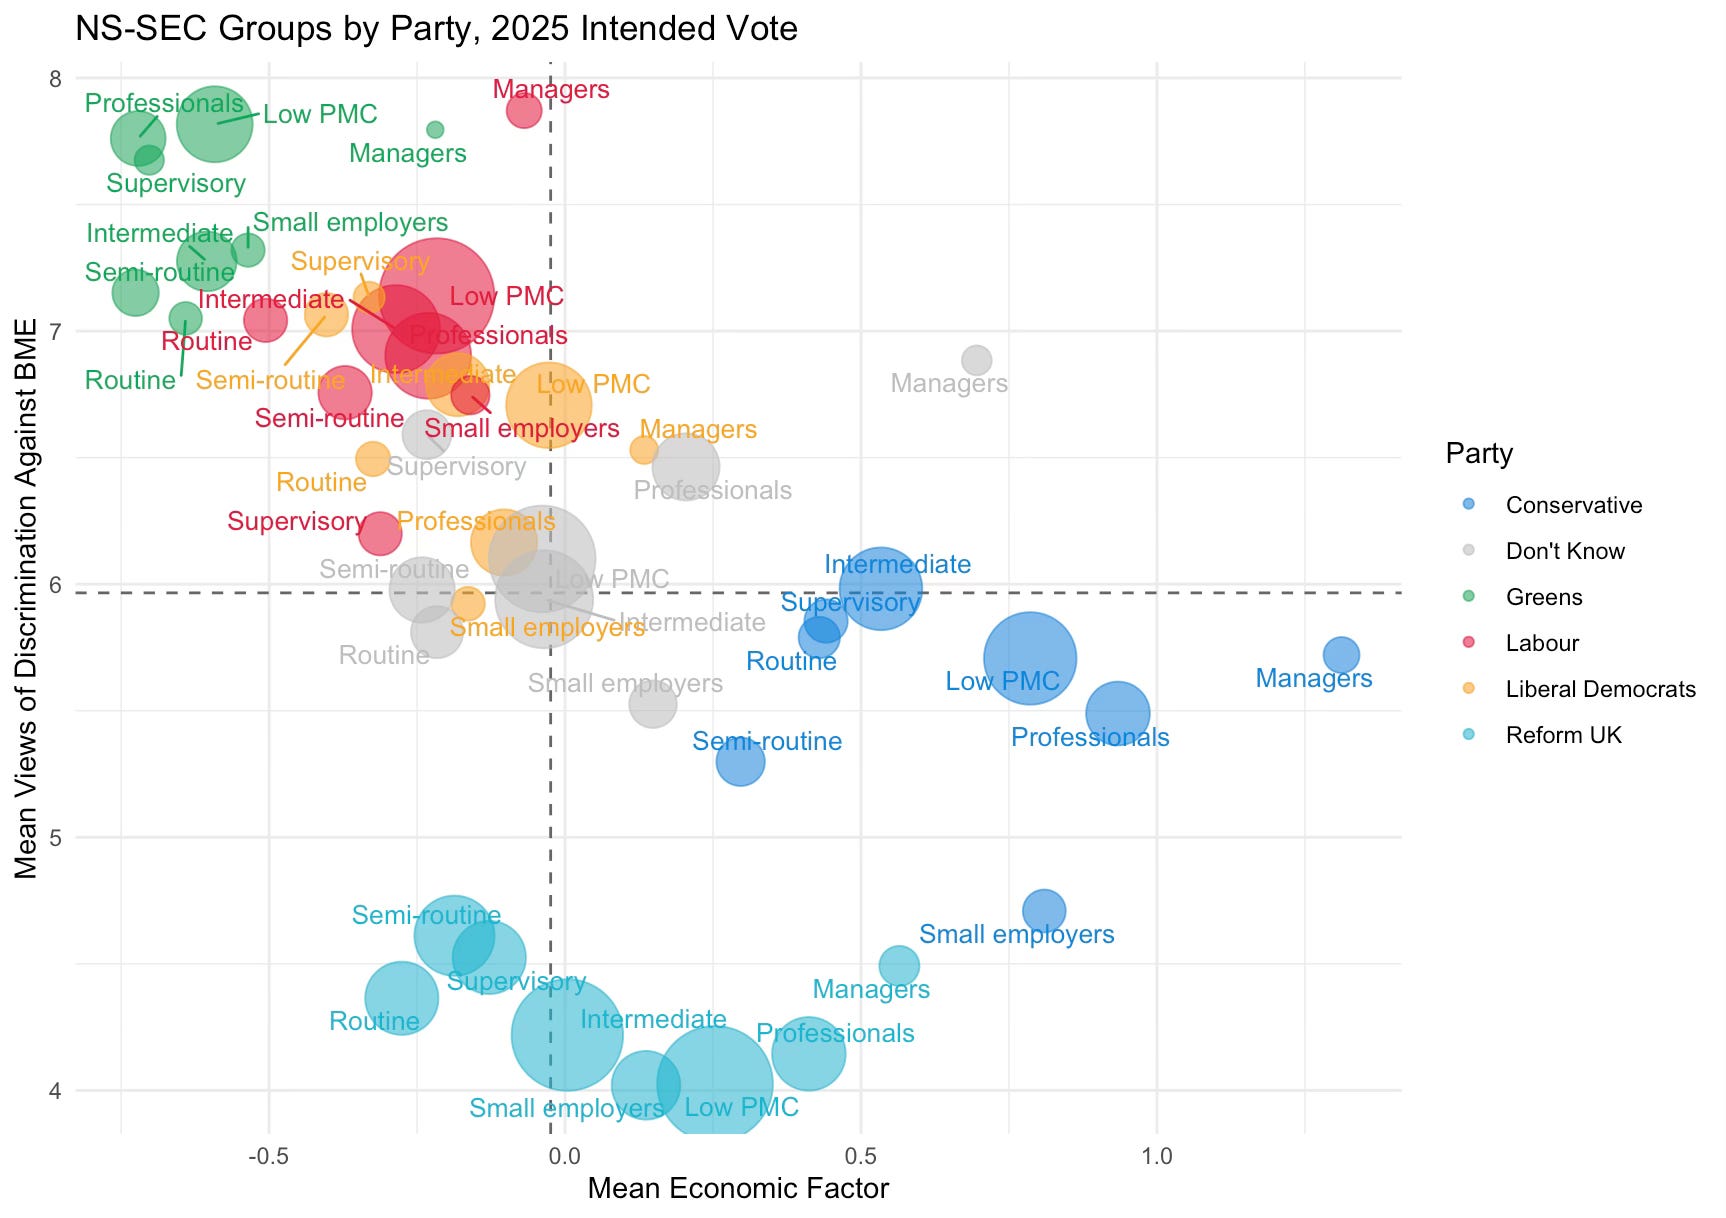
Finally, let’s look at discrimination in favour or against ethnic groups. We start with Blacks and Asians (BME in BES terminology). The average is six - a bit higher than for women and gays and lesbians and somewhat lower than for transgender people. The order of parties is largely as before and again with lots of overlap among Labour and the Lib Dems. Almost everyone in Britain thinks ethnic minorities face discrimination against them, including most Conservatives. Except for one group again - and this time extremely obviously: Reform voters. Every single occupational group among Reform voters believes that ethnic minorities experience positive discrimination. Joined once more by Conservative small employers. Together they form a slightly grim smile at the bottom of the graph.
What about that other ethnic group - White British. You may recall me writing a variety of pieces wondering why this group was suddenly being viewed as the ur-category to which all other British citizens were unfavourably compared. Well, here’s one explanation for what’s going on. The average level of discrimination people think White British people experience is just under five - in other words, at the margin slight discrimination in favour. And Don’t Knows and many Conservatives are at about that level, with Labour and the Lib Dems clustering just under four and the Greens just under three.
And then there are Reform voters, who average just under seven. Even Conservative small employers can’t keep up with that. Managers who support Reform are almost at an eight. Just to compare that to what Reform voters think about discrimination against ethnic minorities - every single group of Reform voters not only thinks white Brits are more discriminated against than ethnic minorities but they do so by over two points on the ten point scale. 382 Reform voters chose a ten (most discriminated against) for whites. Only 74 did for ethnic minorities.
OK that’s our individual discrimination questions. Let’s go back to our factor analysis from earlier. Last time we just had one dimension of ‘anti-discrimination’ views but it feels like more is going on than just that. So let’s use two factors to split up our questions rather than just one. Here’s what we get in terms of loadings:
Discrimination vs Gays and Lesbians: Factor One 0.989; Factor Two 0
Discrimination vs White British: Factor One 0; Factor Two 0.850
Discrimination vs BME: Factor One 0.515; Factor Two -0.377
Discrimination vs Men: Factor One 0; Factor Two 0.693
Discrimination vs Transgender: Factor One 0.813; Factor Two 0
Discrimination Against Women: Factor One 0.372; Factor Two 0
So, Factor One seems to be more focused on discrimination against ‘traditional’ minorities and Factor Two is discrimination against ‘dominant’ groups. That’s similar to the single factor we had earlier, except now we can see the variation on both. The first factor captures about 34% of overall variation across the six questions, and the second one captures another 23%. They are obviously strongly negatively correlated and so you might wonder what the value added is. But splitting them out does show something quite striking. Here’s the figure.
Annoyingly for you, I am plotting Factor Two (discrimination is against white men) on the x-axis and Factor One (discrimination is against traditional minorities) on the y-axis. Apols.
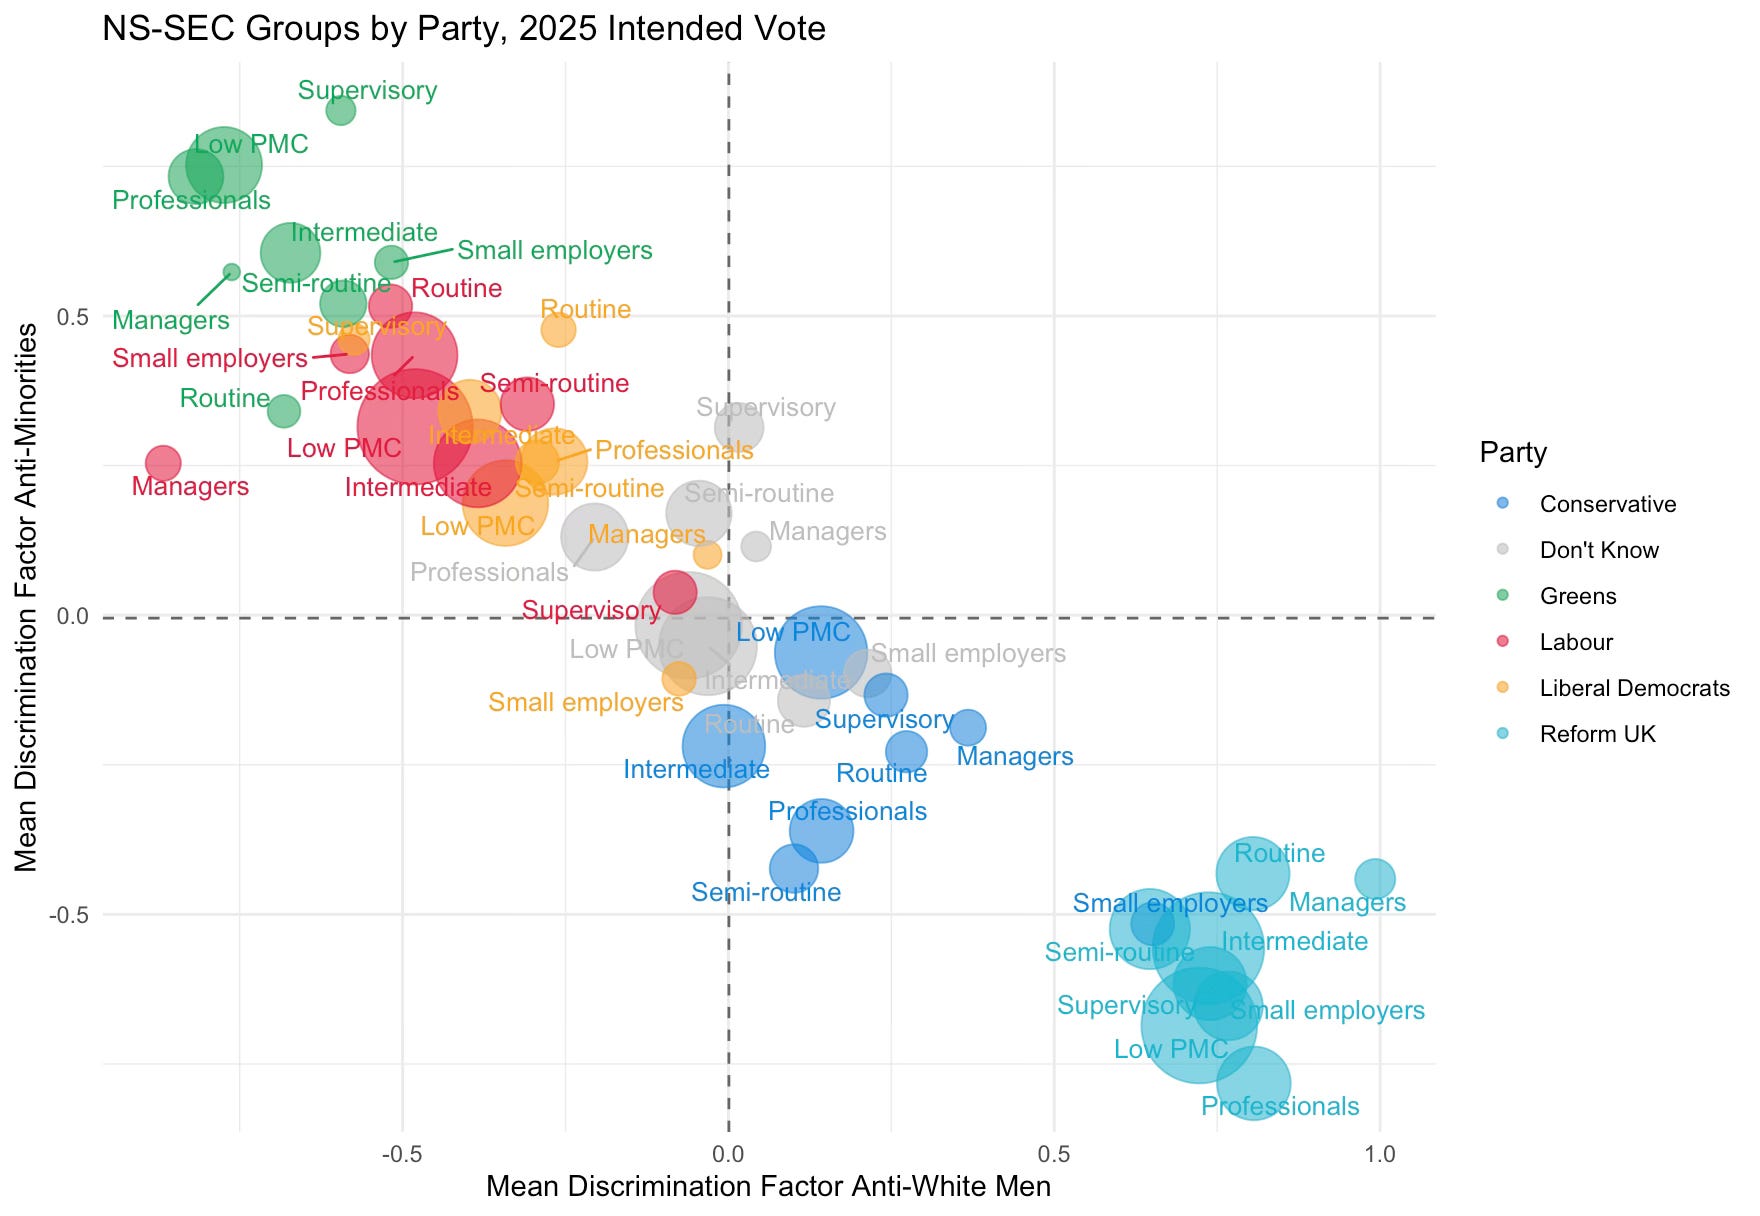
Well, look at that. Here we see Reform voters really are the ‘odd ones out’ - something that has been building up over these graphs. There is a large gap between the other parties and Reform voters (well and also Conservative voting small employers, LOL). The ordering across parties is kind of fascinating - a near perfect sorting, with minimal overlap. It’s like a nice machine learning homework in how to optimally classify British political parties. But an algorithm that was a two year old child, or possibly a cat, could figure out what divides Reform voters from everyone else.
So, that’s it then. It’s Reform voters who are the unrepresentative odd people who are unlike the rest of the British public? Well almost.
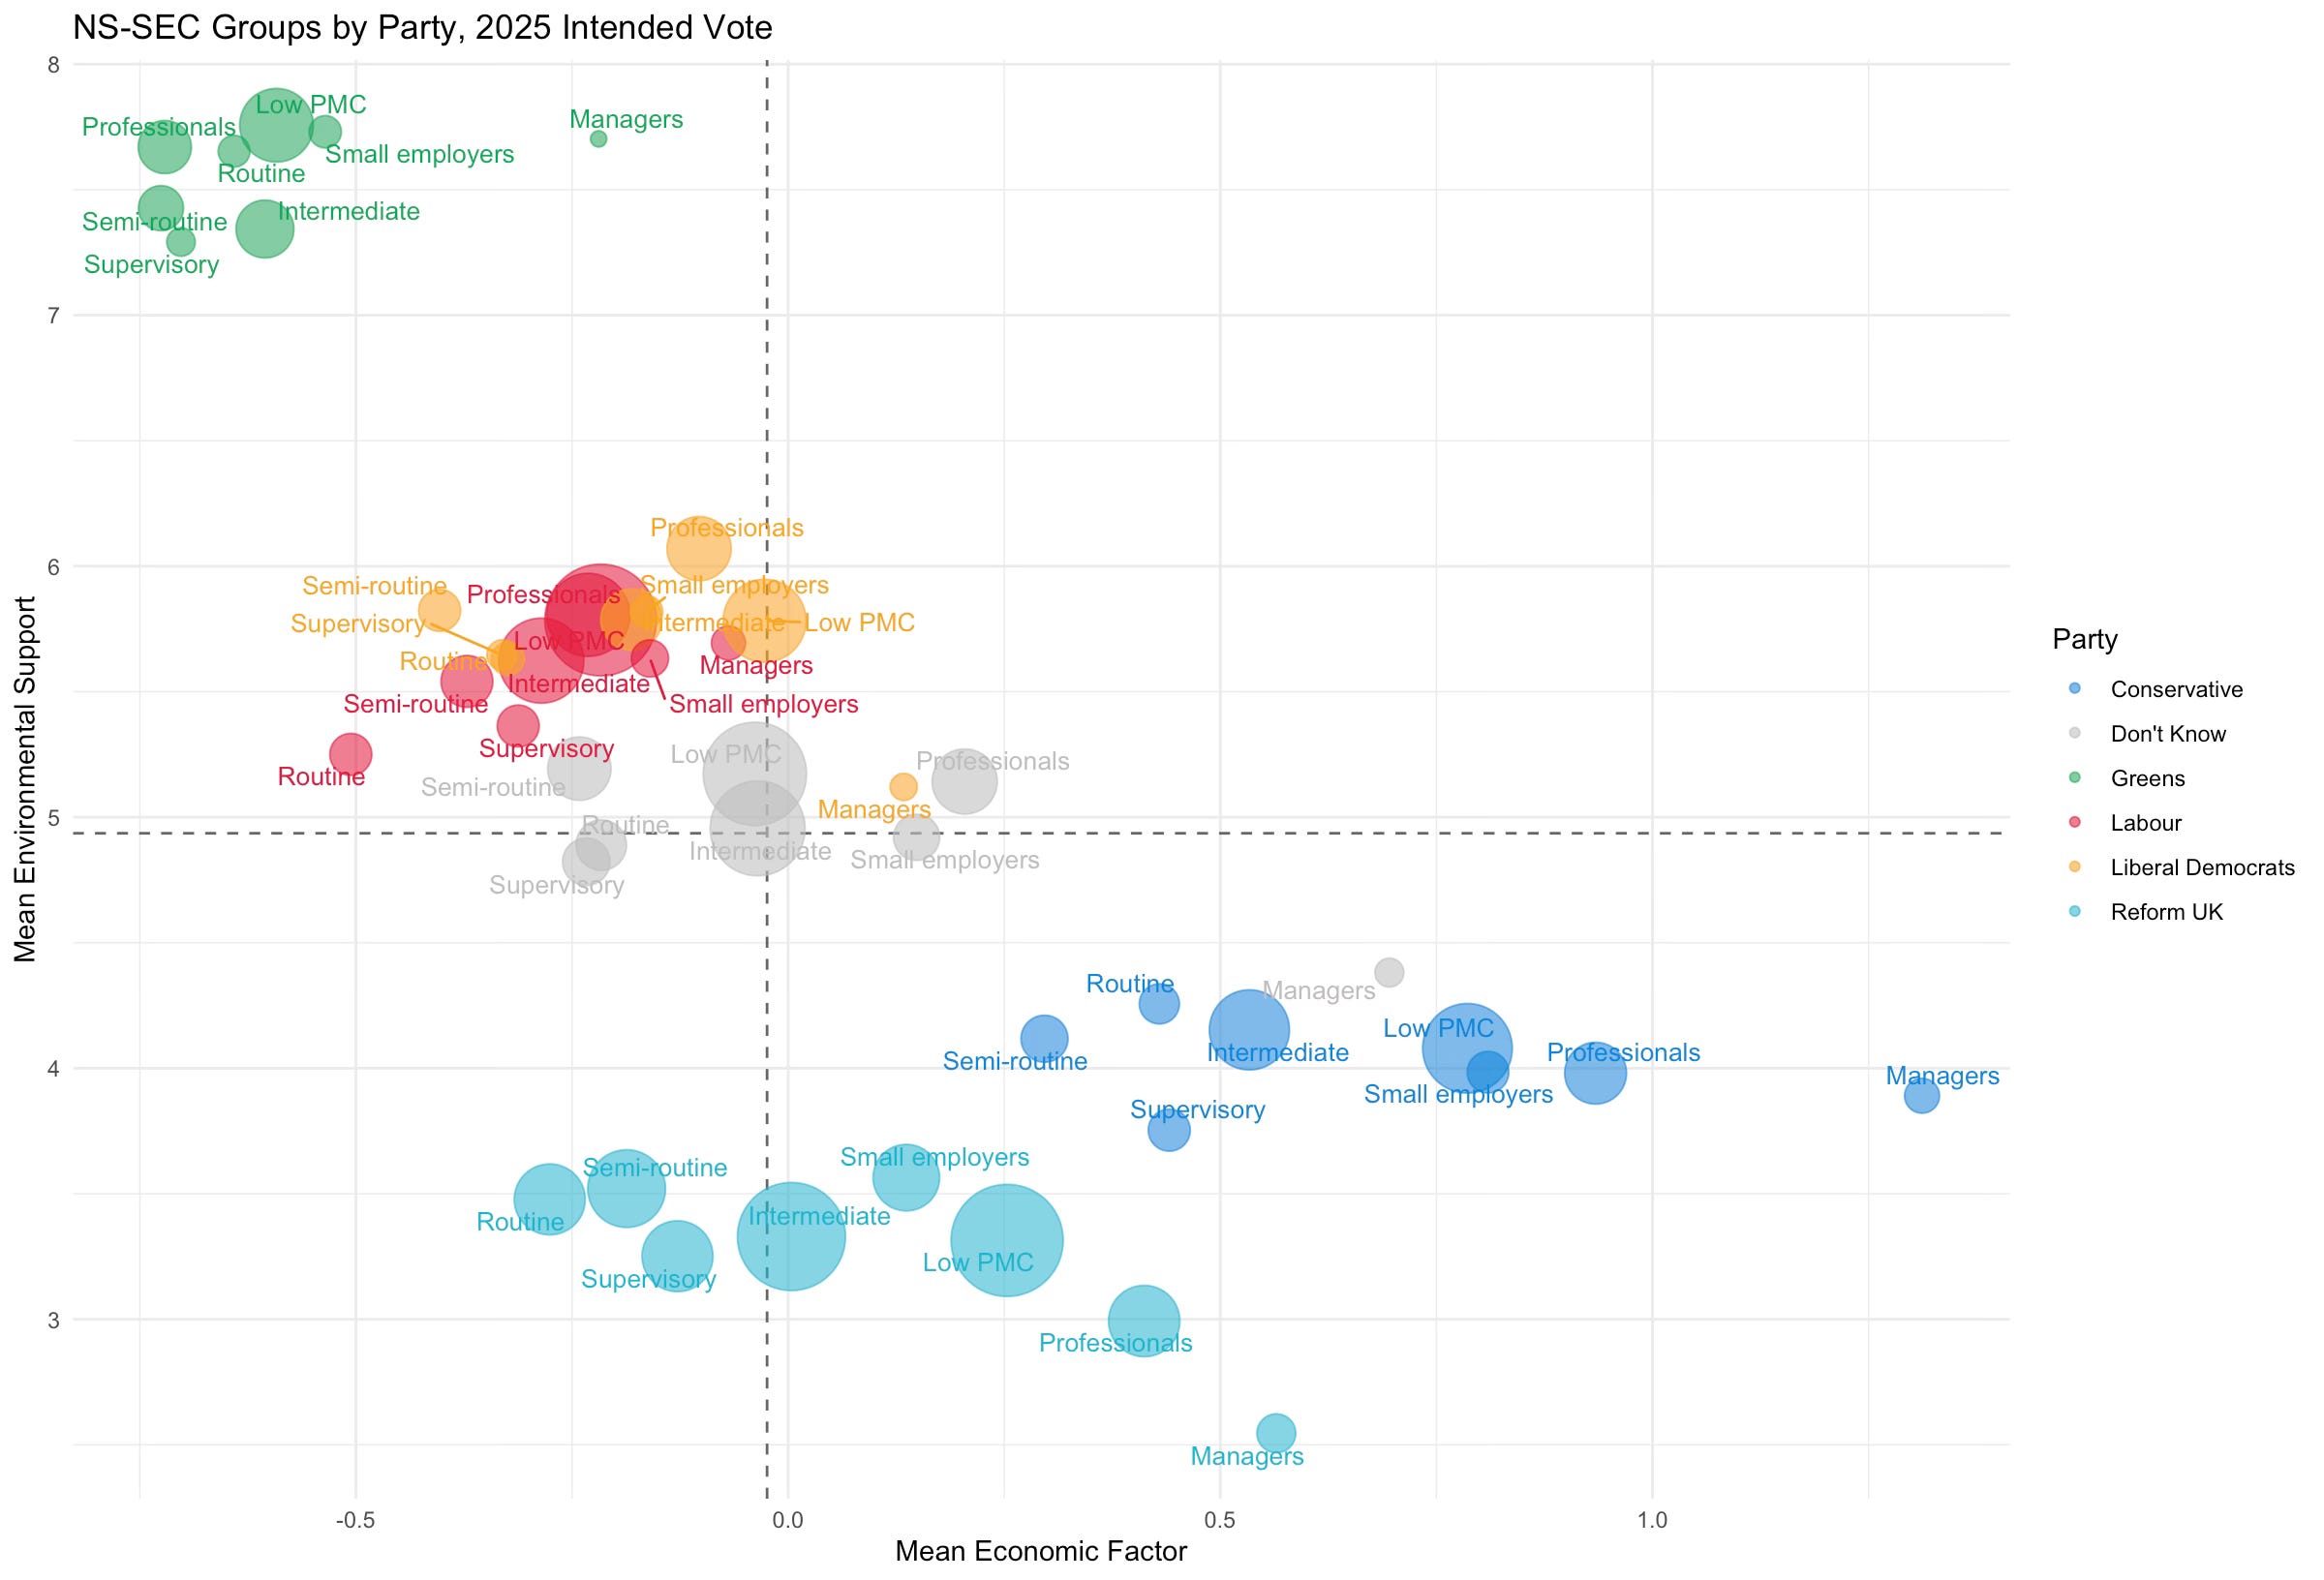
You see, there’s one more policy we haven’t looked at… views about the environment. Here we have a ten point scale asking people to place themselves between two poles - zero being economic growth should have priority over the environment; ten being protecting the environment should have priority over economic growth. The average score is almost exactly five - so well done the fence-sitting British public.
But here’s where voters for different parties sit. Just huge variation. As we have seen a number of times across this series of posts, Labour, Lib Dems and Don’t Knows are all clustered around the same point and are closest to the average, with Conservatives not too far off on the other side (averaging a four). Reform voters are separate once again - all occupational groups lower than everyone else, averaging just over a three. But they are not odd ones out. Because they have a fellow odd one - the Greens, who are all well over a seven on this - indeed further from the average than anyone else.
In a way, it would be pretty weird, maybe depressing, if the Greens were not really pro-environment. They really really are! But it is also the case that this is where they are most different from the rest of the British politics. The Greens are always at the extreme on all social issues but usually just about overlapping with other groups, unlike Reform who are quite regularly beyond the social attitudes pale. But that is most clear when we come to the world of net zero. There are just huge party differences on the environment.
And who are now the two most prominent, increasingly popular, politicians in Britain? Why it’s Nigel Farage and Zach Polanski. British politics is experiencing centrifugal forces. The rising parties are polar opposites of one another when it comes to social issues. And they also divide on economic lines too, though less dramatically.
And if anything it’s this that raises some vague hope for the Labour government. Yes perhaps the attractiveness of the centre has vanished and people are moving to the extremes. But come election time, in a First Past the Post system, it is usually the centre that holds. I might think Morgan McSweeney is overstating the case for tactical voting against Reform - people who vote for the Greens are quite distinct on economic and social issues from Labour voters (thought Lib Dems and Don’t Knows are not). But come election time, it’s not mad to think that centrifugal motion will be replaced by centripetal forces - a sucking sound towards the centre.
Do I finally have good news for Labour, then? Well, maybe. But remember how successful my last few posts have been in predicting what they would do, seemingly compelling them to do precisely the opposite of my recommendation. So, you know what, I wouldn’t rely on it.
That’s not quite right because the factor analysis also includes five economic attitude questions, and so the factor is weighting across ten questions - it just much more heavily weights the five cultural questions. More on this in the previous posts.
Fascinating. Is the same sort of data available over a decent timespan? I can't help wondering whether these Reform-supporting outliers were always there (in such numbers) and in Reform have now found a home, or whether over recent years they've been encouraged to hold and given permission to share what are newly-held opinions?