
Labour at the Margin...
...of survival

Before hitting the graphs, a couple of updates from recent writing. A few months back I wrote about the merits and demerits of a left populism strategy for Labour. This was followed by a piece, building on an old Substack of mine, about the dismal arrival of ethnonationalism on the British political scene. And this month, I’ve written a Stephen King inspired piece on the ‘long walk’ to 2029. Keep your pace up…
Well it’s been quite a week for large British institutions whose leadership are at constant loggerheads with their Trump-hating employees and supporters and whose unwillingness to admit past strategic failures has left them in complete crisis.
Being leader of the Labour Party might feel increasingly like being Director General of the BBC - or indeed England Manager - in terms of absolutely cursed jobs. But as of today, perhaps even Tim Davie might wryly smile at the turmoil enveloping Sir Keir Starmer.
Since Labour have, as Tim Shipman remarked, decided to engage in a dead cat strategy to save the BBC from its news cycle from hell, I thought it might be worth returning to my quasi-viral bubble graphs from a few weeks back that broke out the social attitudes of British voters by occupation group.
In that post, I argued that Labour’s strategy to target Reform voters was going to be extremely challenging to pull off, since the social attitudes of people intending to vote Reform are miles away from Labour’s core voters and indeed the people who have shifted from Labour to ‘Don’t Know’ or to the Greens or Lib Dems. Since fewer than ten percent of Labour 2024 voters had shifted to Reform, much smaller than to these other groups, this seemed a rather quixotic strategy.
It is of course a strategy associated with the Blue Labour tendency within Labour and particularly with its lodestone Morgan McSweeney, a man who appears to have set off a new firestorm over the past 24 hours. Maybe… Anonymous Number 10 aides and all that. But the fact that Blue Labour guru/cult leader (take your choice) Lord Glasman was the Labour representative on last night’s Newsnight is at least very funny and at most delightfully apt. You see Maurice, that’s what being in the stocks is like.
Nonetheless, there is a point to the Blue Labour strategy - it relies on Labour’s most marginal seats being those where it faces a challenge from Reform. So average attitudes of Labour voters or ex-voters be damned - what matters in FPTP is what happens at the margin. And a number of people, including Labour MPs, had asked me to look at how my beautiful bubble graphs would fare taking this into account.
Well someone needs to be responsive to backbench Labour MPs, so why not me.
I’ve matched the British Election Study data from this May (which I used last time) to results from the 2024 General Election (from my handy election prediction app - quick note to Number 10, I wouldn’t put the current polls into the app without a glass of whisky at your side).
The British Election Survey has over 30,000 respondents across 630 constituencies (it lacks Northern Ireland). And I can define six types of seats in terms of results last year. I’m going to define three types of Labour seats. Super-marginal Labour seats are those where they won with a majority of less than five percent - this is 51 seats in the BES. Marginal seats are those where they won with a five to fifteen percent majority (I’m defining marginal this way since Labour have lost around 12-16 points in the polling since the election) - this is another 116 seats. Finally we have ‘safe’ Labour seats, where the majority is over 15 points - that’s 243 seats. Yes, I know this doesn’t add up to 411 seats but to 410 and all I can say is, um, maybe the BES didn't sample a constituency - an exciting mystery.
Then we have the 72 Lib Dem seats and I have 119 for the Conservatives (2 down from their actual 121) and 29 Other seats, which includes the SNP, Plaid, Reform, the Greens, and the various Independents plus the Speaker. Apologies to fans of any of the above parties (or indeed of Sir Lindsey Hoyle) but I am clumping these together. And the reason I am doing so is we want to look at averages among voters - we have about 50 per constituency in the BES sample. Clumping them into these six groups gives us a minimum of 1500 odd voters in the Other group, through to over 11,000 in the Safe Labour group.
Remember this is by constituency ‘type’ - what we can do next is break each of these types of constituency into the attitudes of voters for different parties who live in them. So we can split out who people intend to vote for from the kind of place they live and hopefully answer the question put to me by various folks. And we can also see whether voters in the Labour-held super-marginals and marginals really are that different from other voters.
So let’s do that. Here is a quick plot of the average views on a suite of economic questions and a suite of cultural questions by constituency type. If you want to know what those questions are and how I combined them (factor analysis) there’s lots of detail in last time’s post.
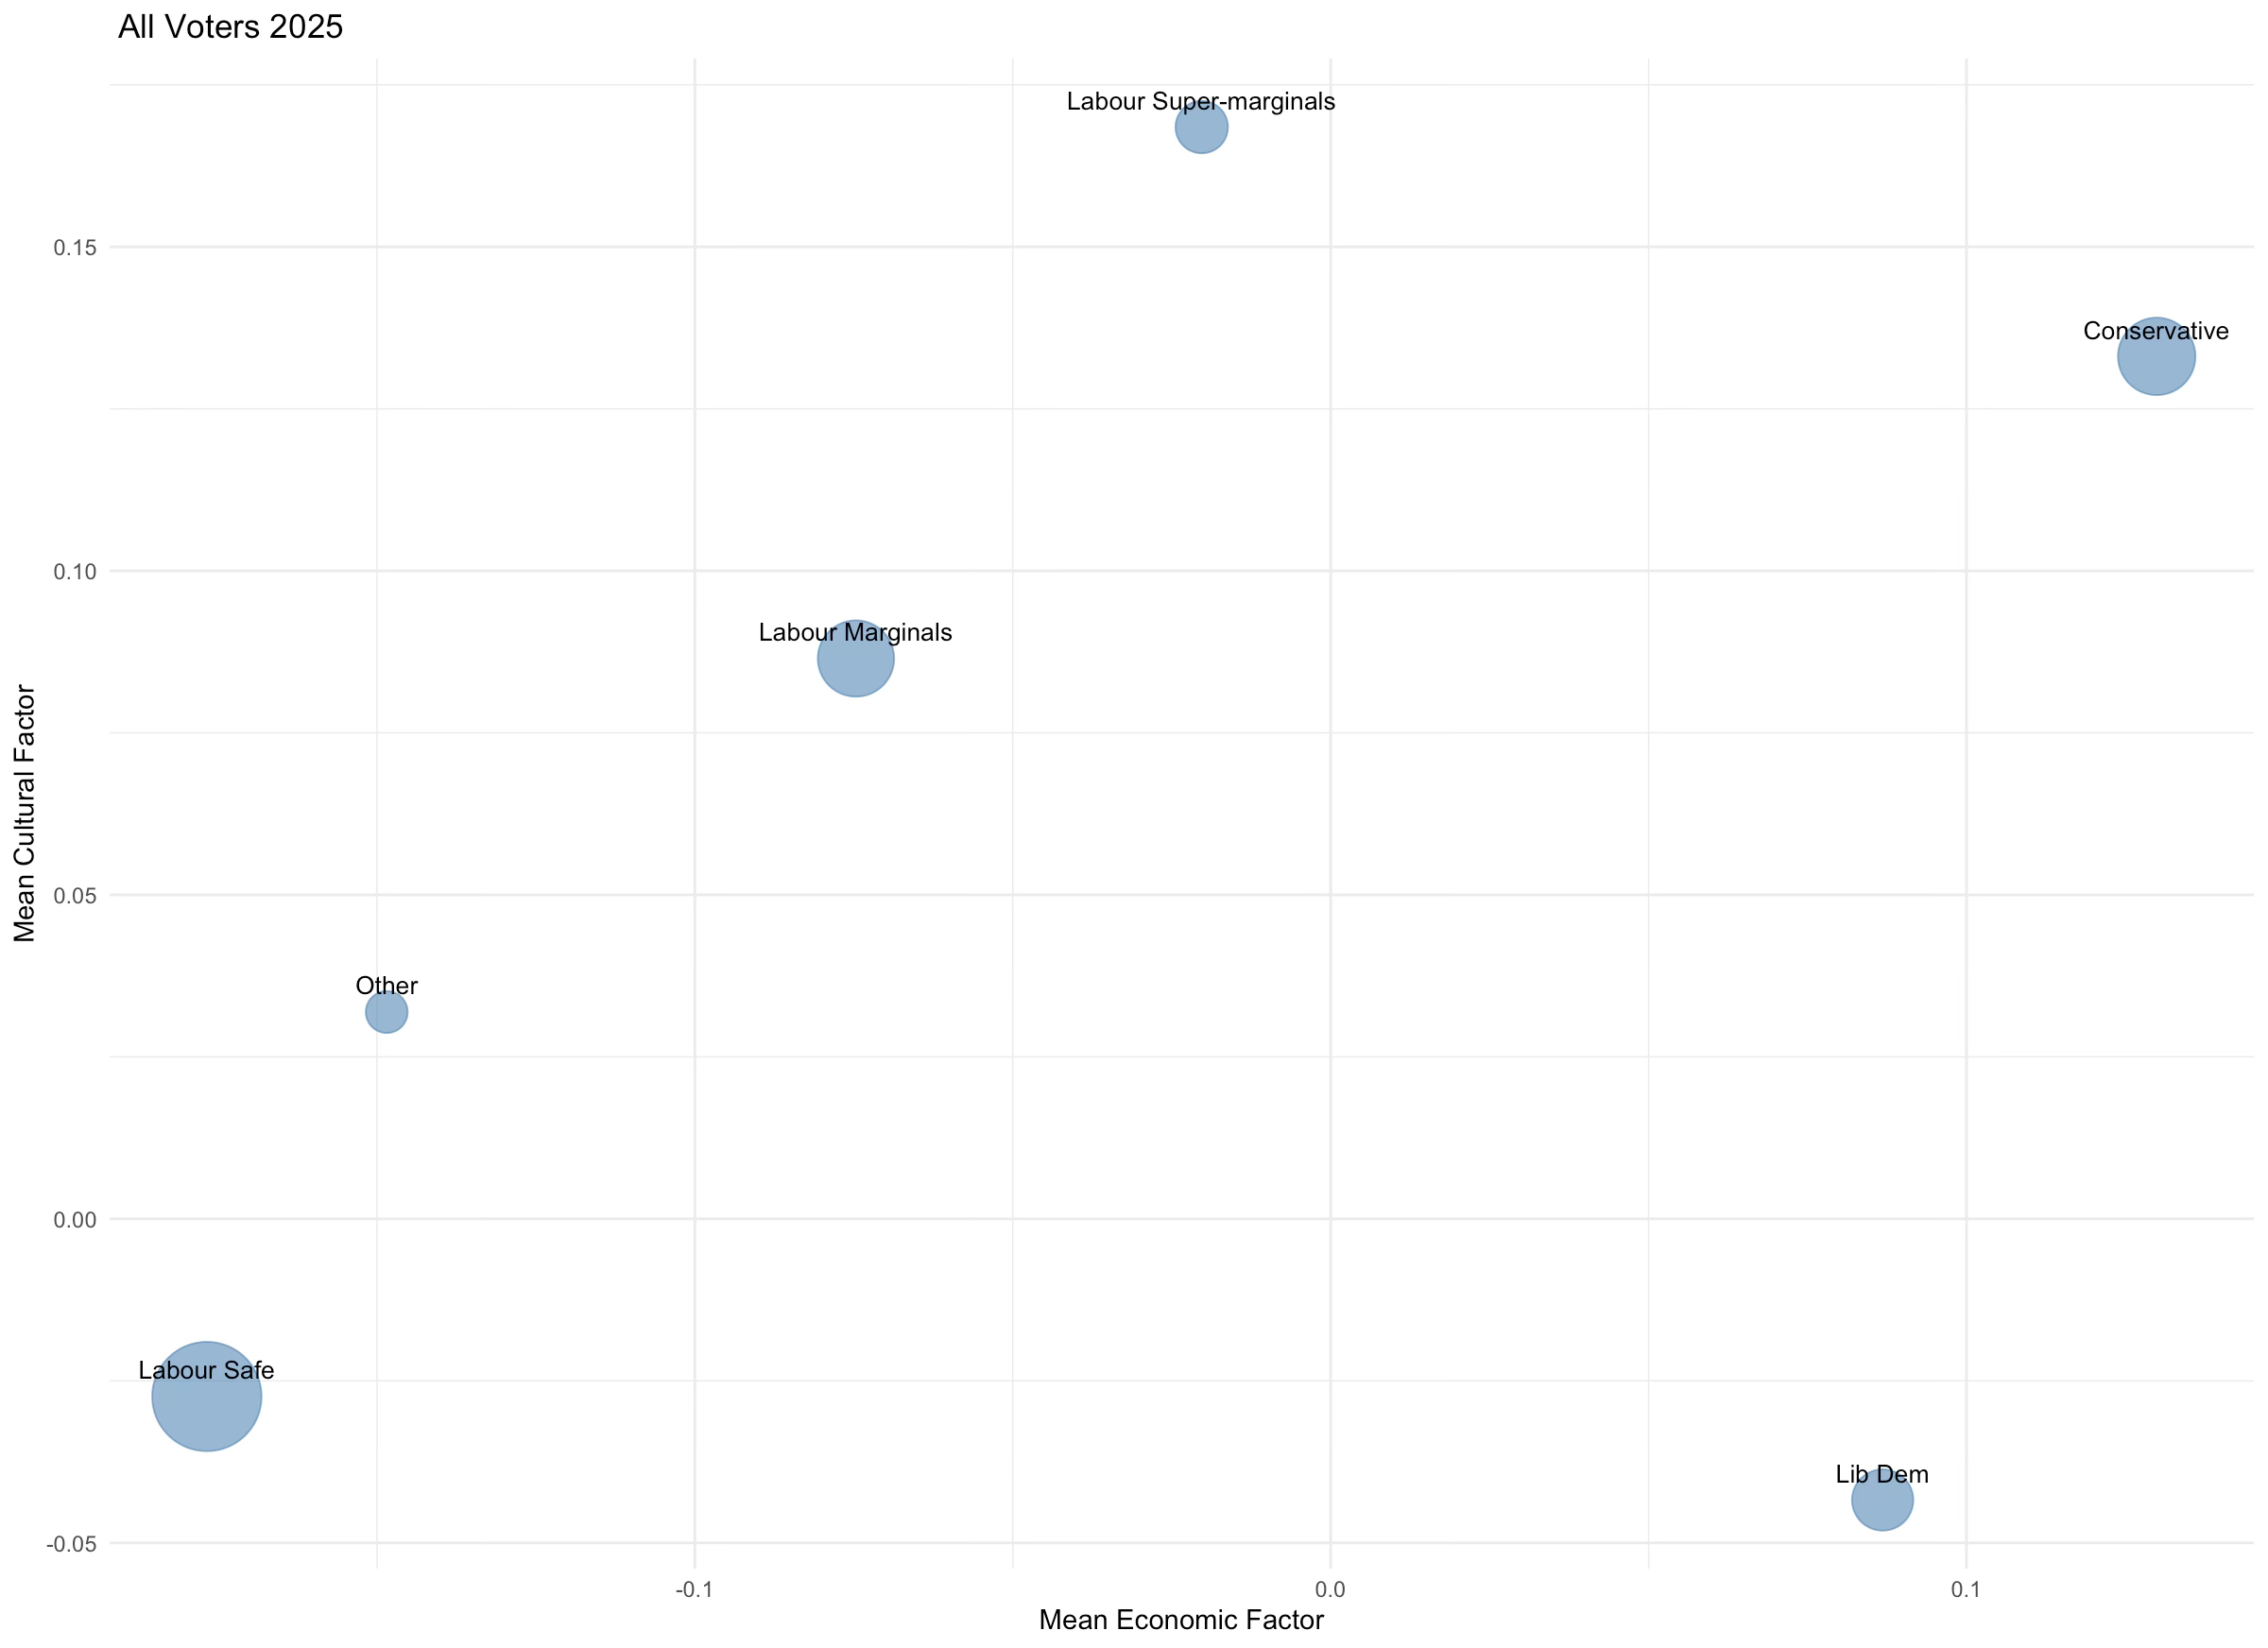
Oooooh. Lots going on there. Hooray for Morgan! You can see here that Labour Marginals and Super-marginals look much more socially conservative in terms of who their voters are on average than Safe Labour seats. Indeed, voters in Labour super-marginals are on average more socially conservative even than voters in Conservative held seats. Score One for Blue Labour, Zero for Ansell.
Except…
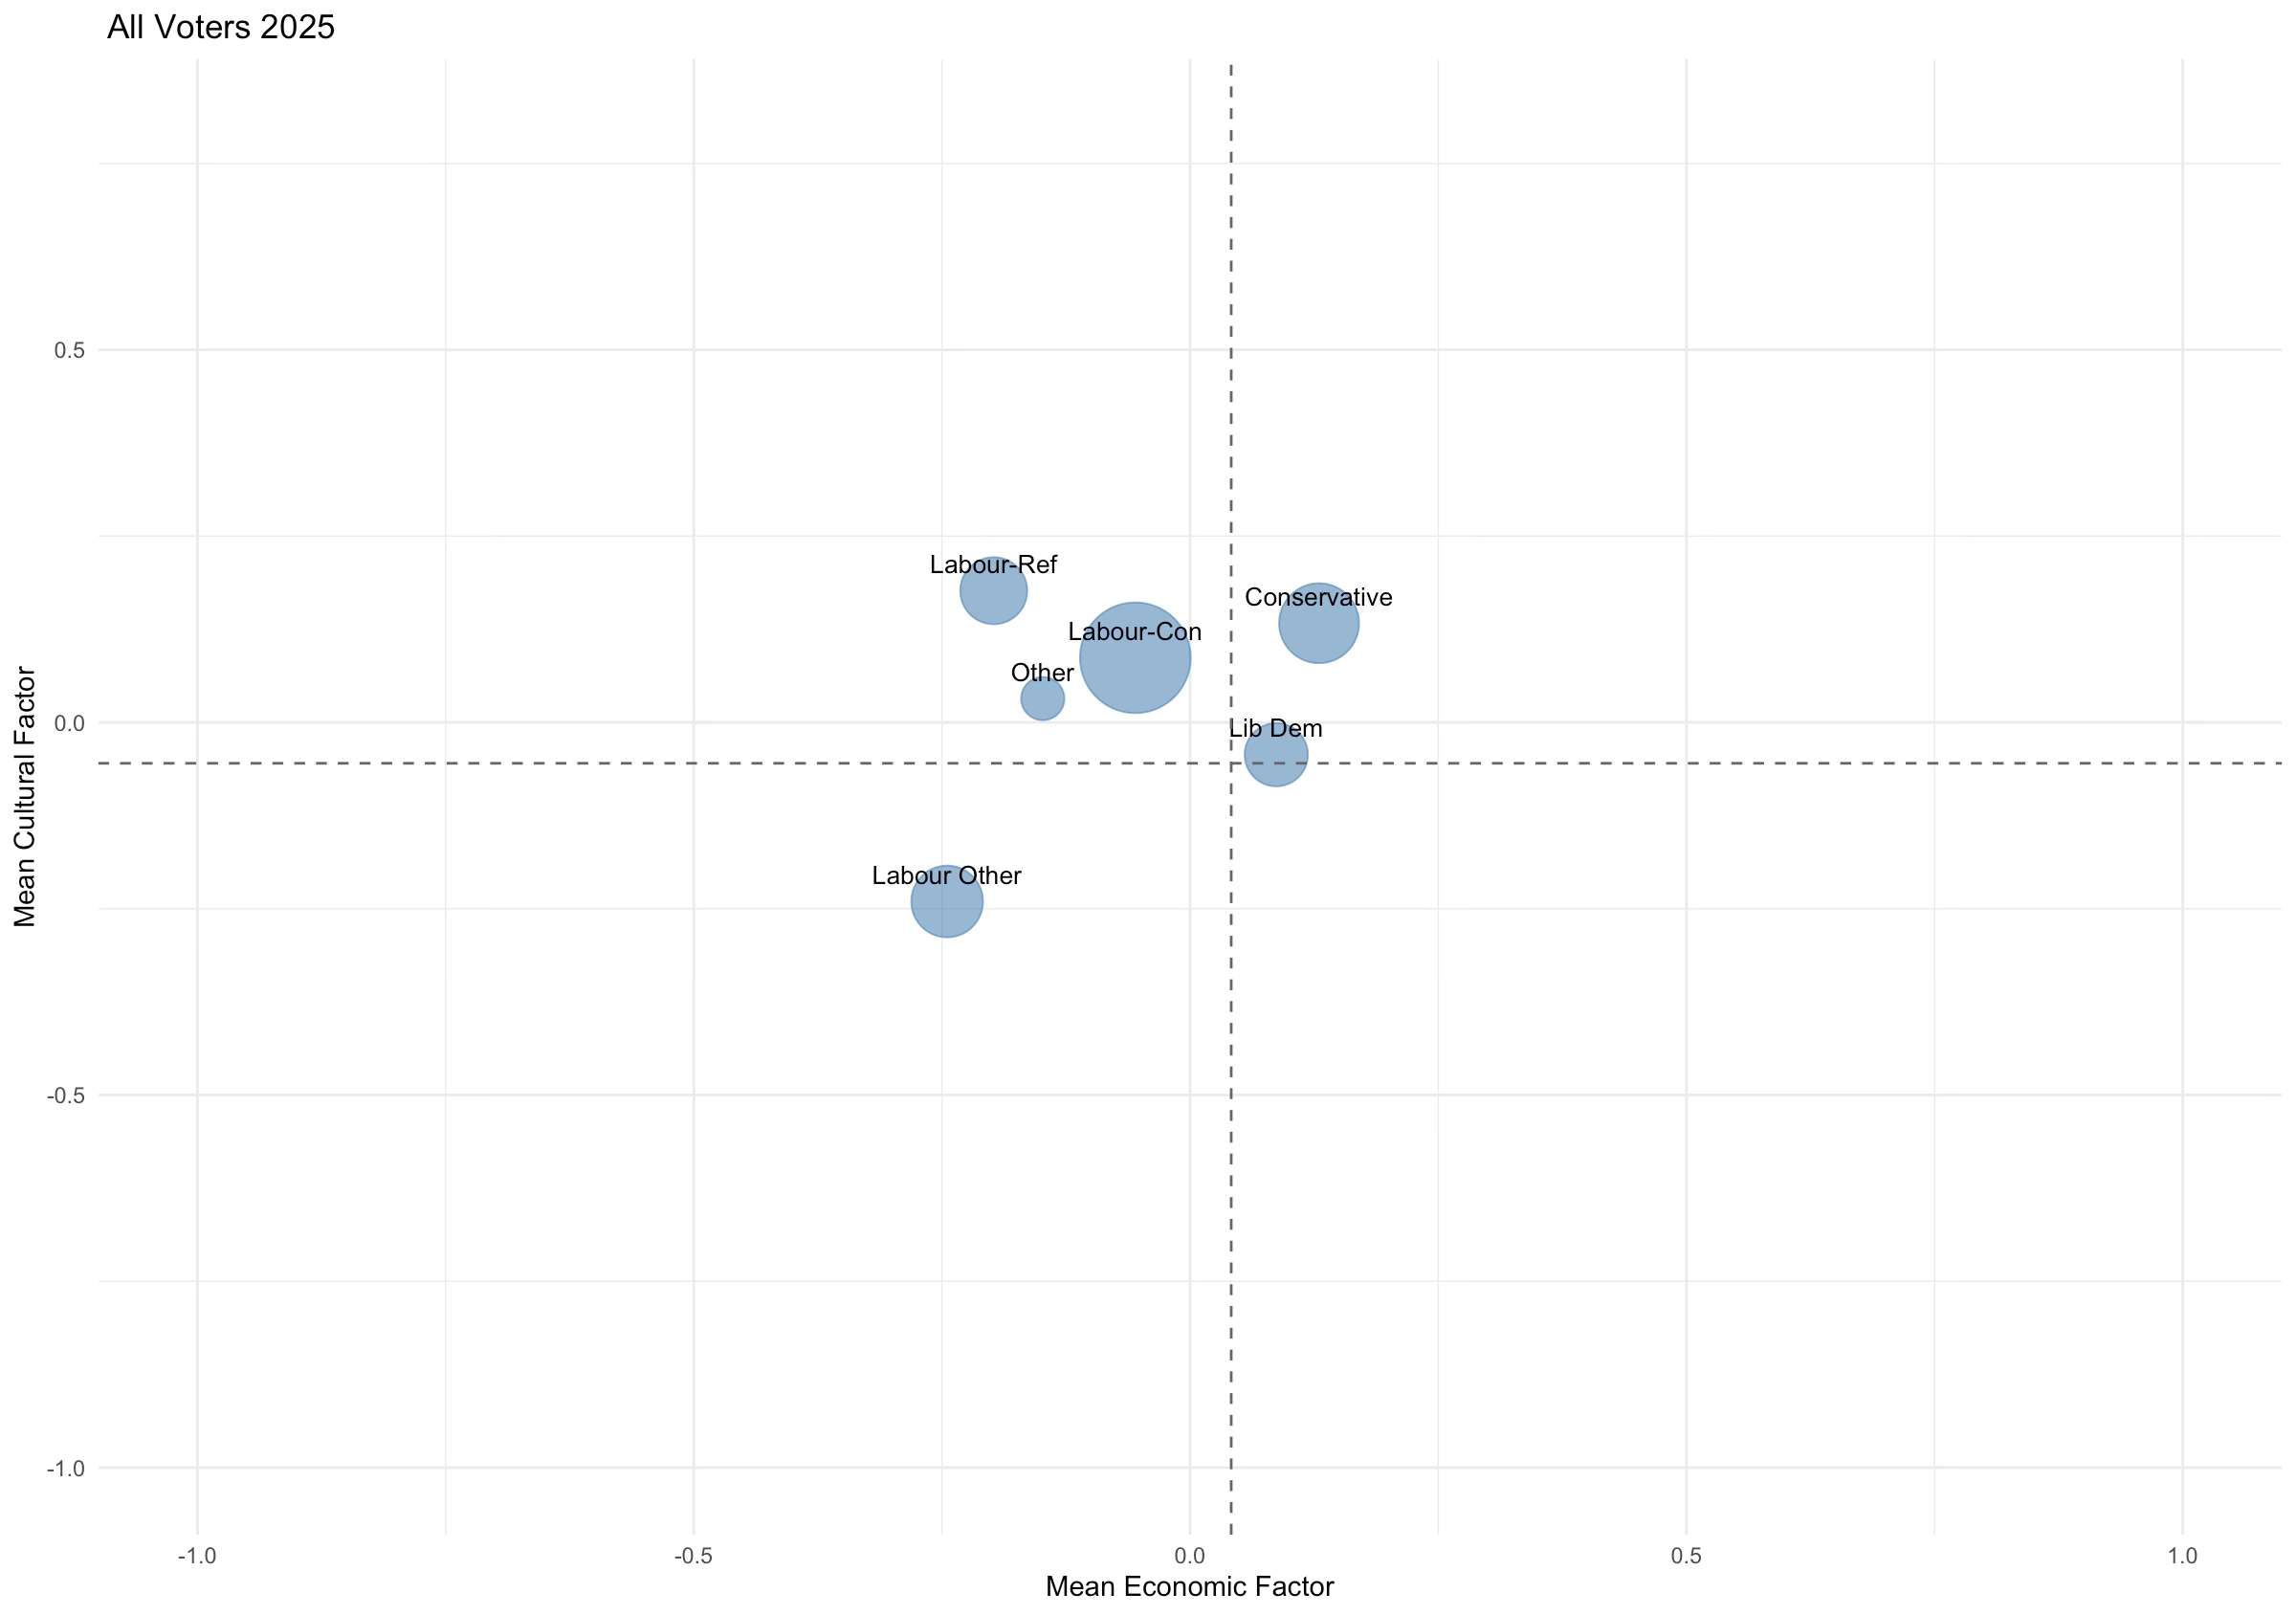
Look at the scales. Actually that probably doesn’t mean a lot yet. But bear with me. Let me zoom this picture out a little (I’ve also added lines with the weighted averages of the two factors for the whole dataset).
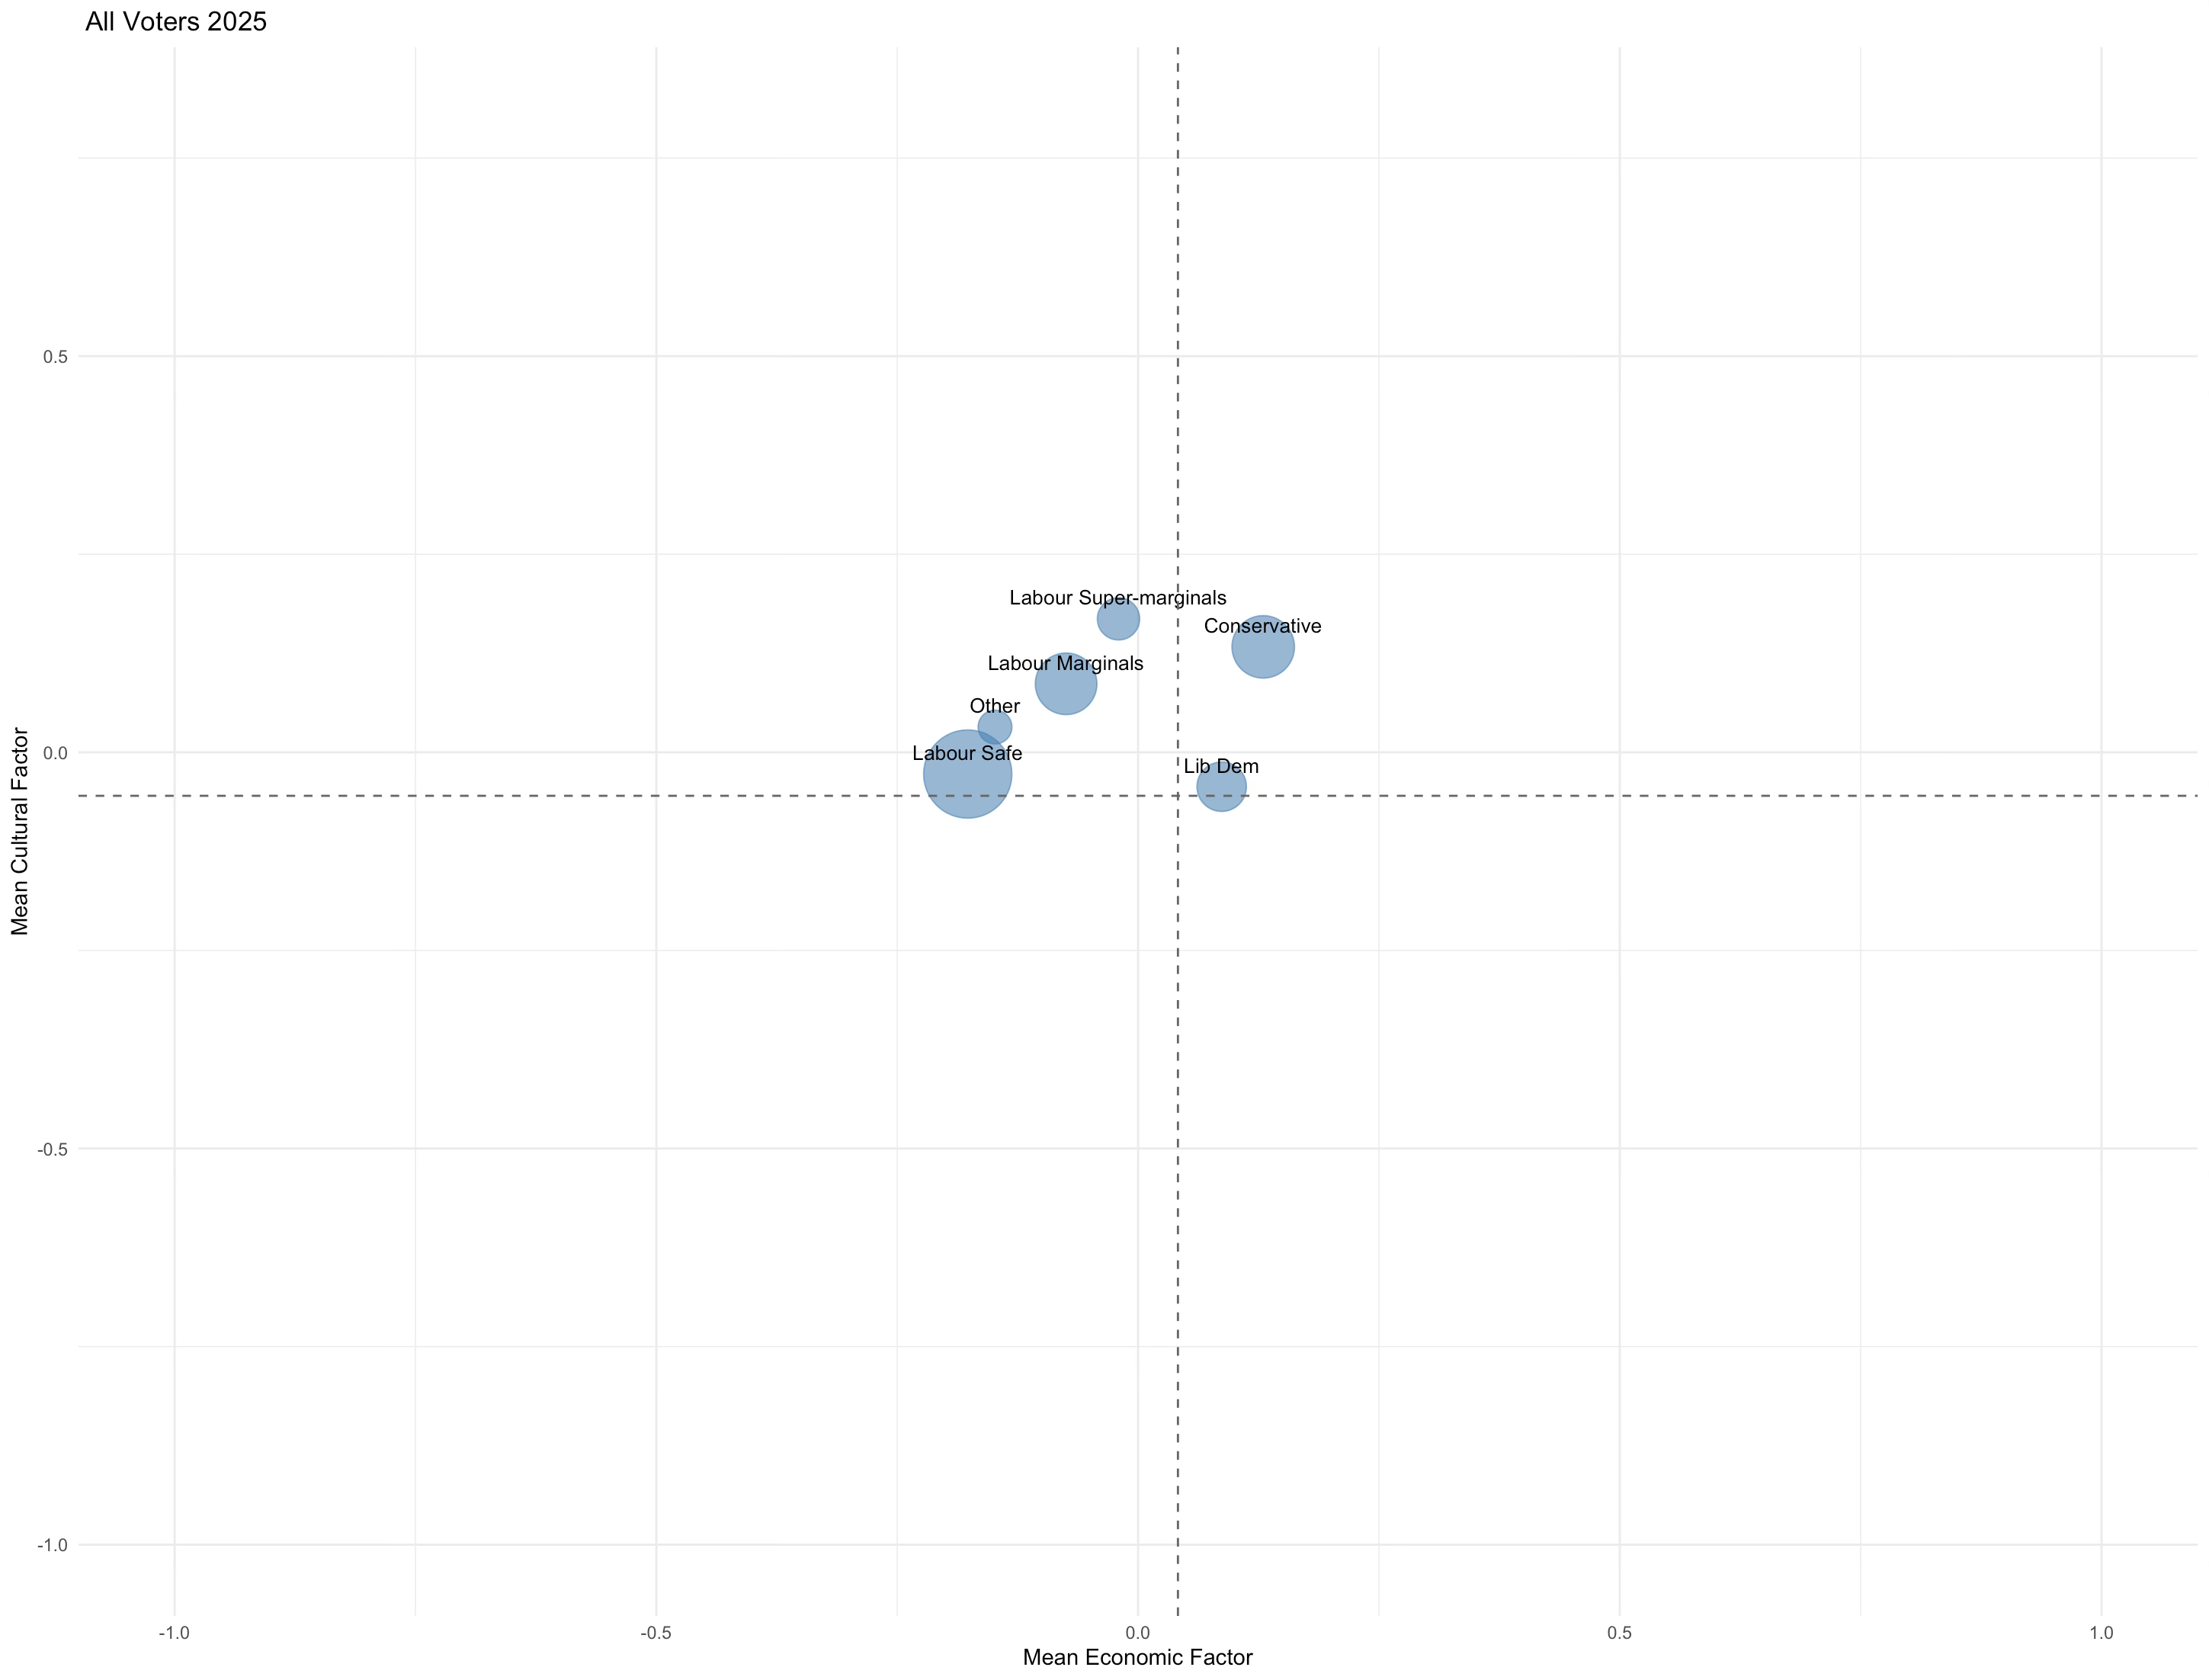
What you see here is some clustering - because I zoomed out. Why did I do that? What kind of trick am I trying to play?
Well you see the thing is, average attitudes in constituency type hides rather a lot of variation. What if I broke people out by their vote intention as well as where they live but keep things at the same scale?
Ahhh. In the previous figure, all the different averages clustered right around the middle (basically where the don’t knows are now). But in this figure we can see that people who intend to vote for Labour have basically the same attitudes whatever type of constituency they live in. That’s essentially true for every party. People who intend to vote for Reform have the same views regardless of where they live (OK they are slightly more economically right-wing in Conservative and Lib Dem districts but not much). Same for the Greens, same for the Lib Dems, same for the Conservatives. Same even for Don’t Knows!!!
There is a basic truth at the heart of this. What matters is people’s party identification not the constituency they live in. Maybe, just maybe, Don’t Knows in Labour Super-marginals are slightly more socially conservative than Don’t Knows in Safe Labour seats but I very much wouldn’t bet on it.
What I think Blue Labour believe is that Labour voters in the marginal Red Wall district have fundamentally different views on social (and maybe economic) issues than Labour voters in safe London seats. They don’t.
We can do this another way. We can split out seats by who the challenger party is. So we can look at Labour seats where the runners-up were the Conservatives (208), where they were Reform (89 seats) or where they were someone else (SNP, Libs, Plaid, etc - 103 seats), and then Conservative, Lib Dem, and Other seats again.
Let’s do the same dance.
Ooh differences! Labour-Reform seats are more socially conservative on average than Labour-Con seats and definitely Labour-Other seats. But now let’s zoom out.
More or less the same deal as before (maybe slightly more variation but it’s fairly marginal).
And now with vote intention.
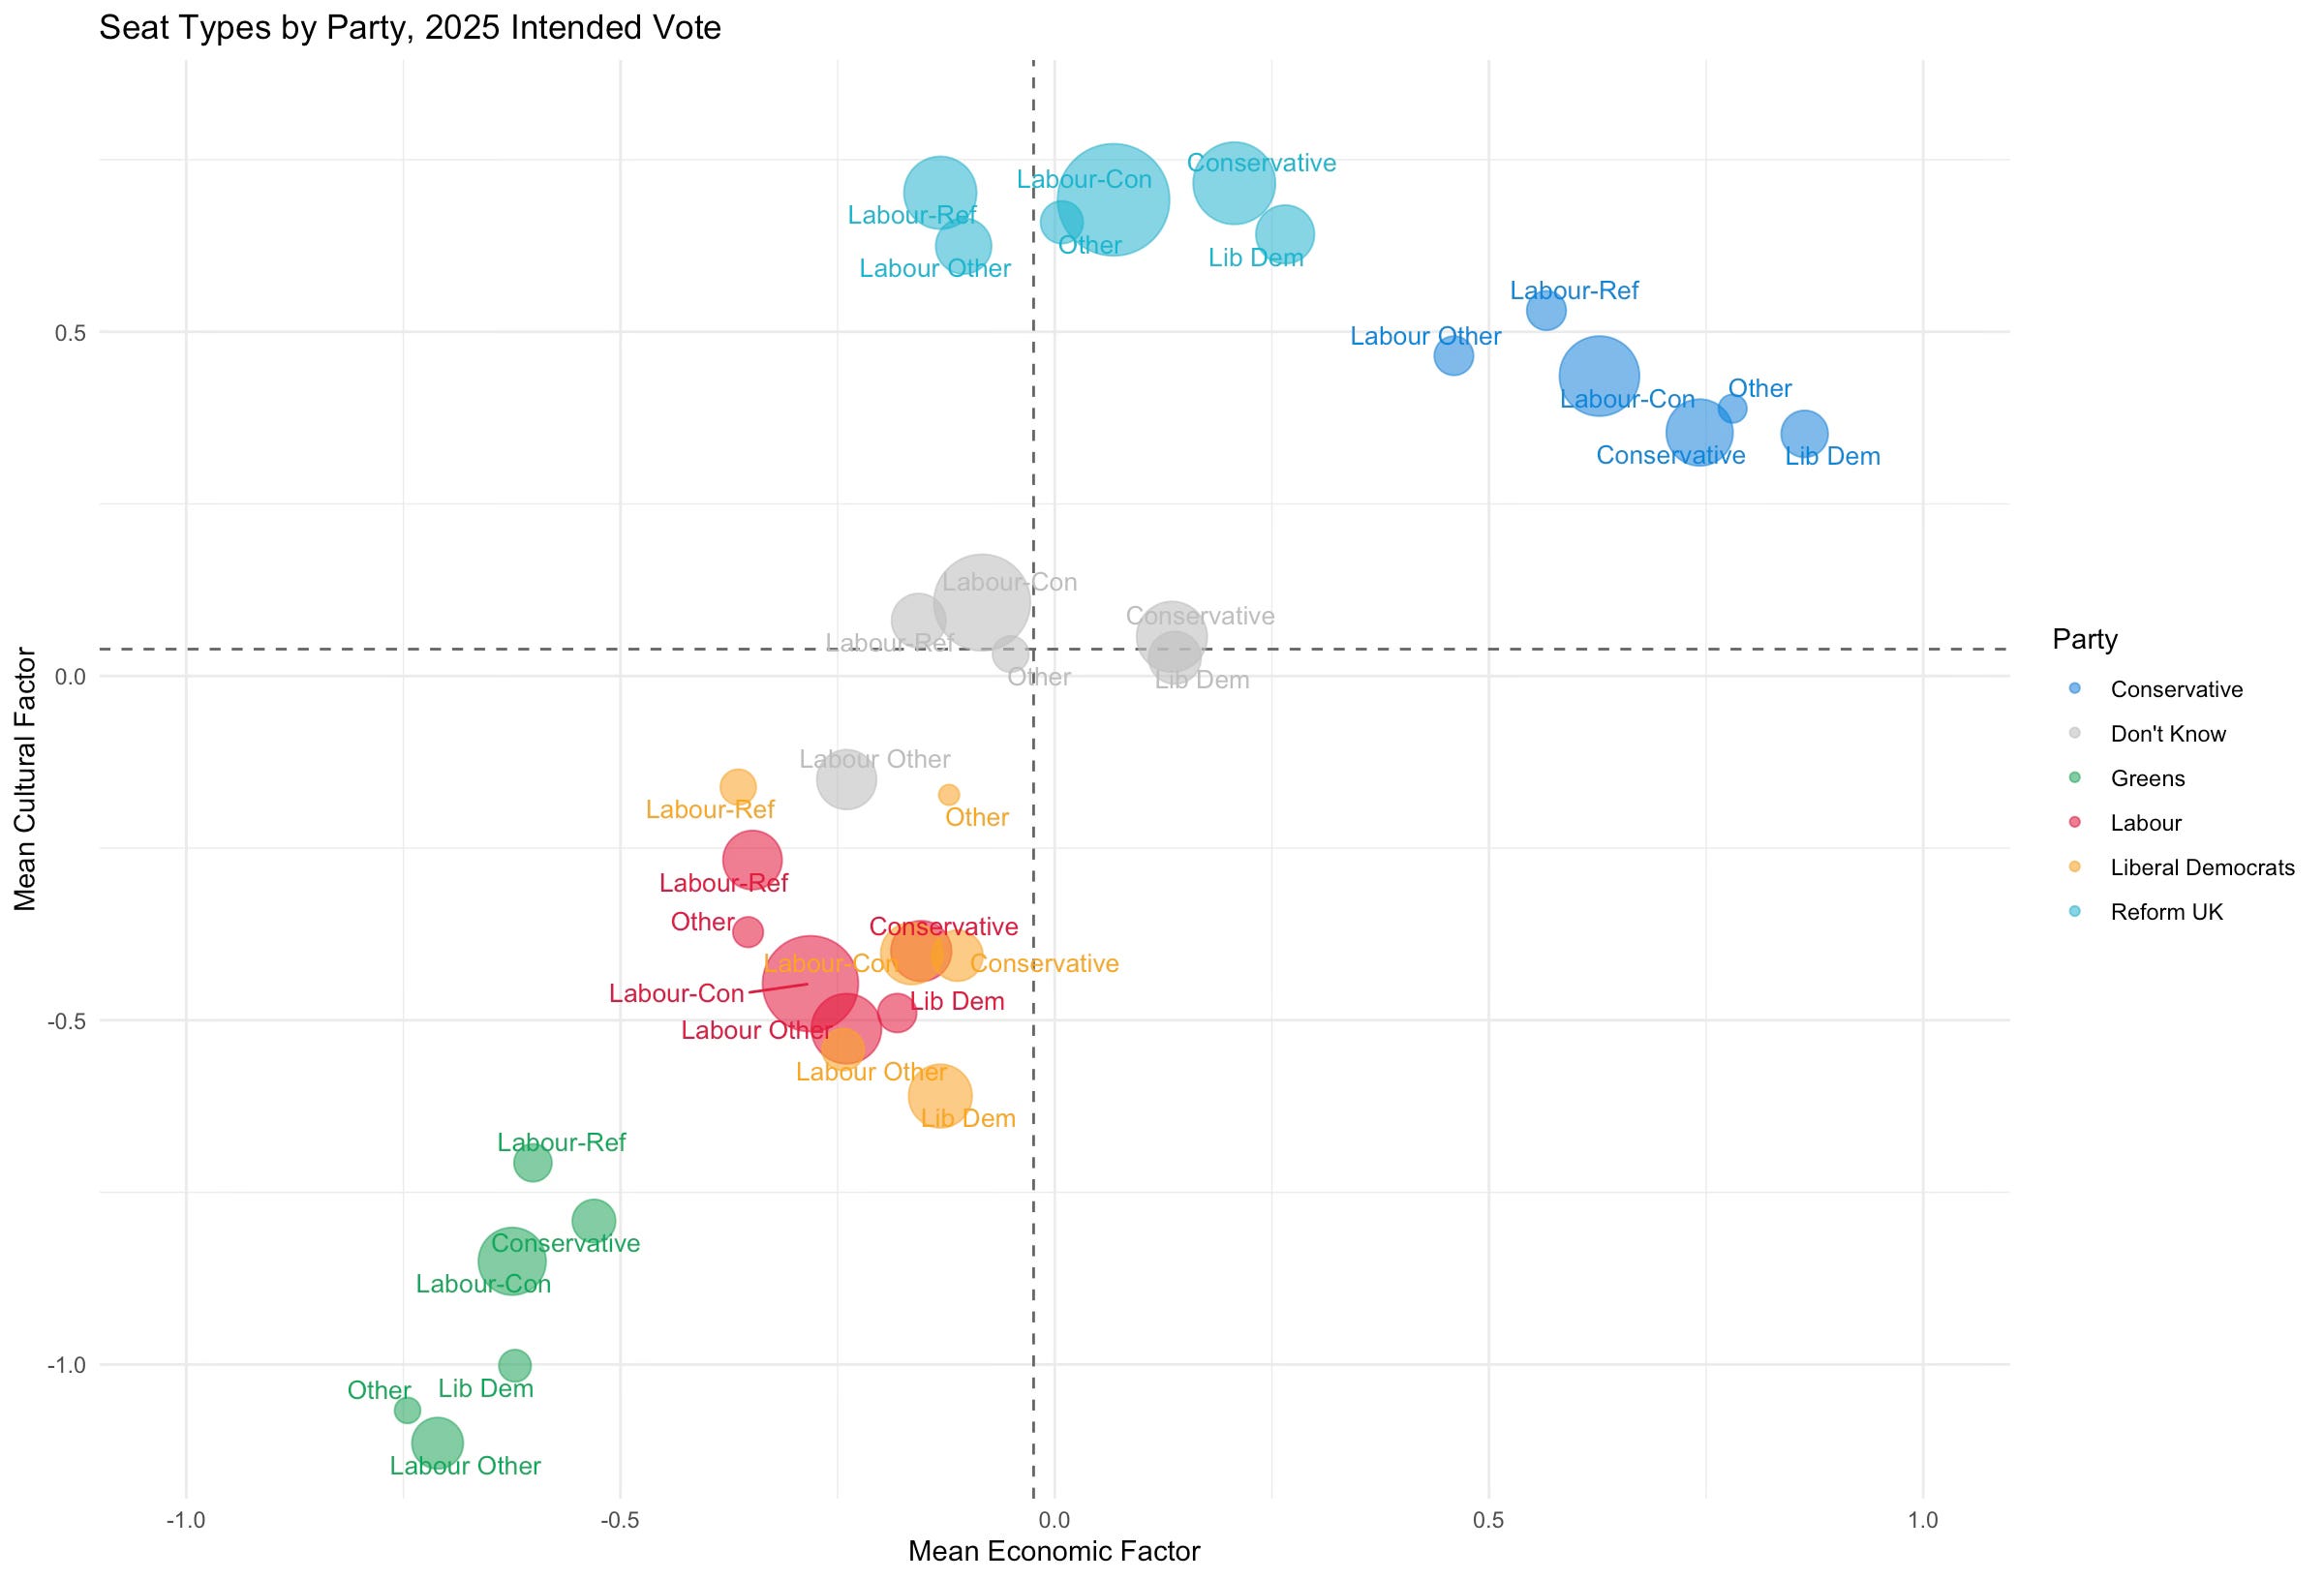
And back we go. Let me say it again for good measure - the differences among voters are among voters not constituencies. Ecological inference is a hell of a drug.
Again we can see little hints of a McSweeney strategy - Labour voters in Labour-Reform seats are a bit more socially conservative than those in Labour-Other seats. But this is really minor stuff compared to the big picture. Just like last time, the basic story is that the Don’t Knows out there, who Labour are losing a lot of voters to are slightly more socially and economically conservative than Labour voters, which is what basically any standard median-voter model of politics would predict. They are not champing at the bit to throw life-long immigrants out of the country or to engage in an attritional war on woke.
We can indeed just limit our analysis to people who voted for Labour in 2024 to get a sense of who Labour should be trying to win back. Now an important point - you can see from above that people inclined to vote for Labour are more left-wing on both dimensions than the average. So we are shifting into a subset of the overall space here.
Here’s the graph I showed last time on the attitudes of Labour 2024 voters in aggregate.
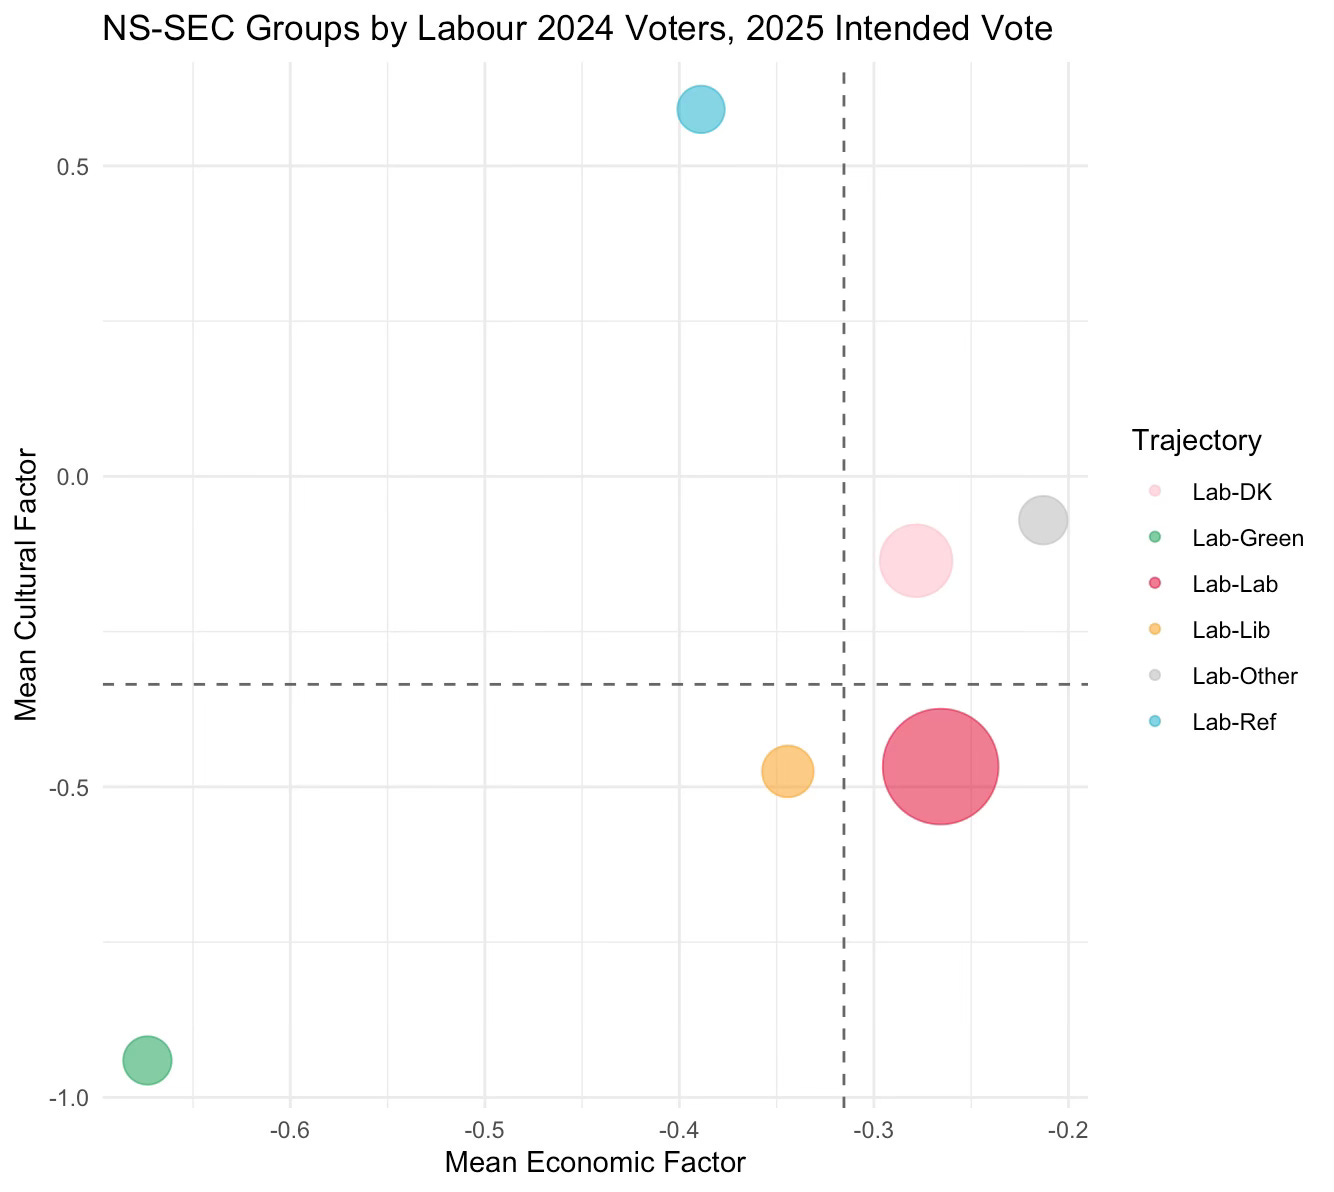
You can see that those shifting to Reform are indeed more socially conservative. but remember, that’s only as many as have shifted to the Greens, or the Lib Dems, or Other. And it’s substantially less than those who have shifted to Don’t Know. Indeed the three latter groups look rather a lot like Labour loyalists. What happens if we split out by type of seat?
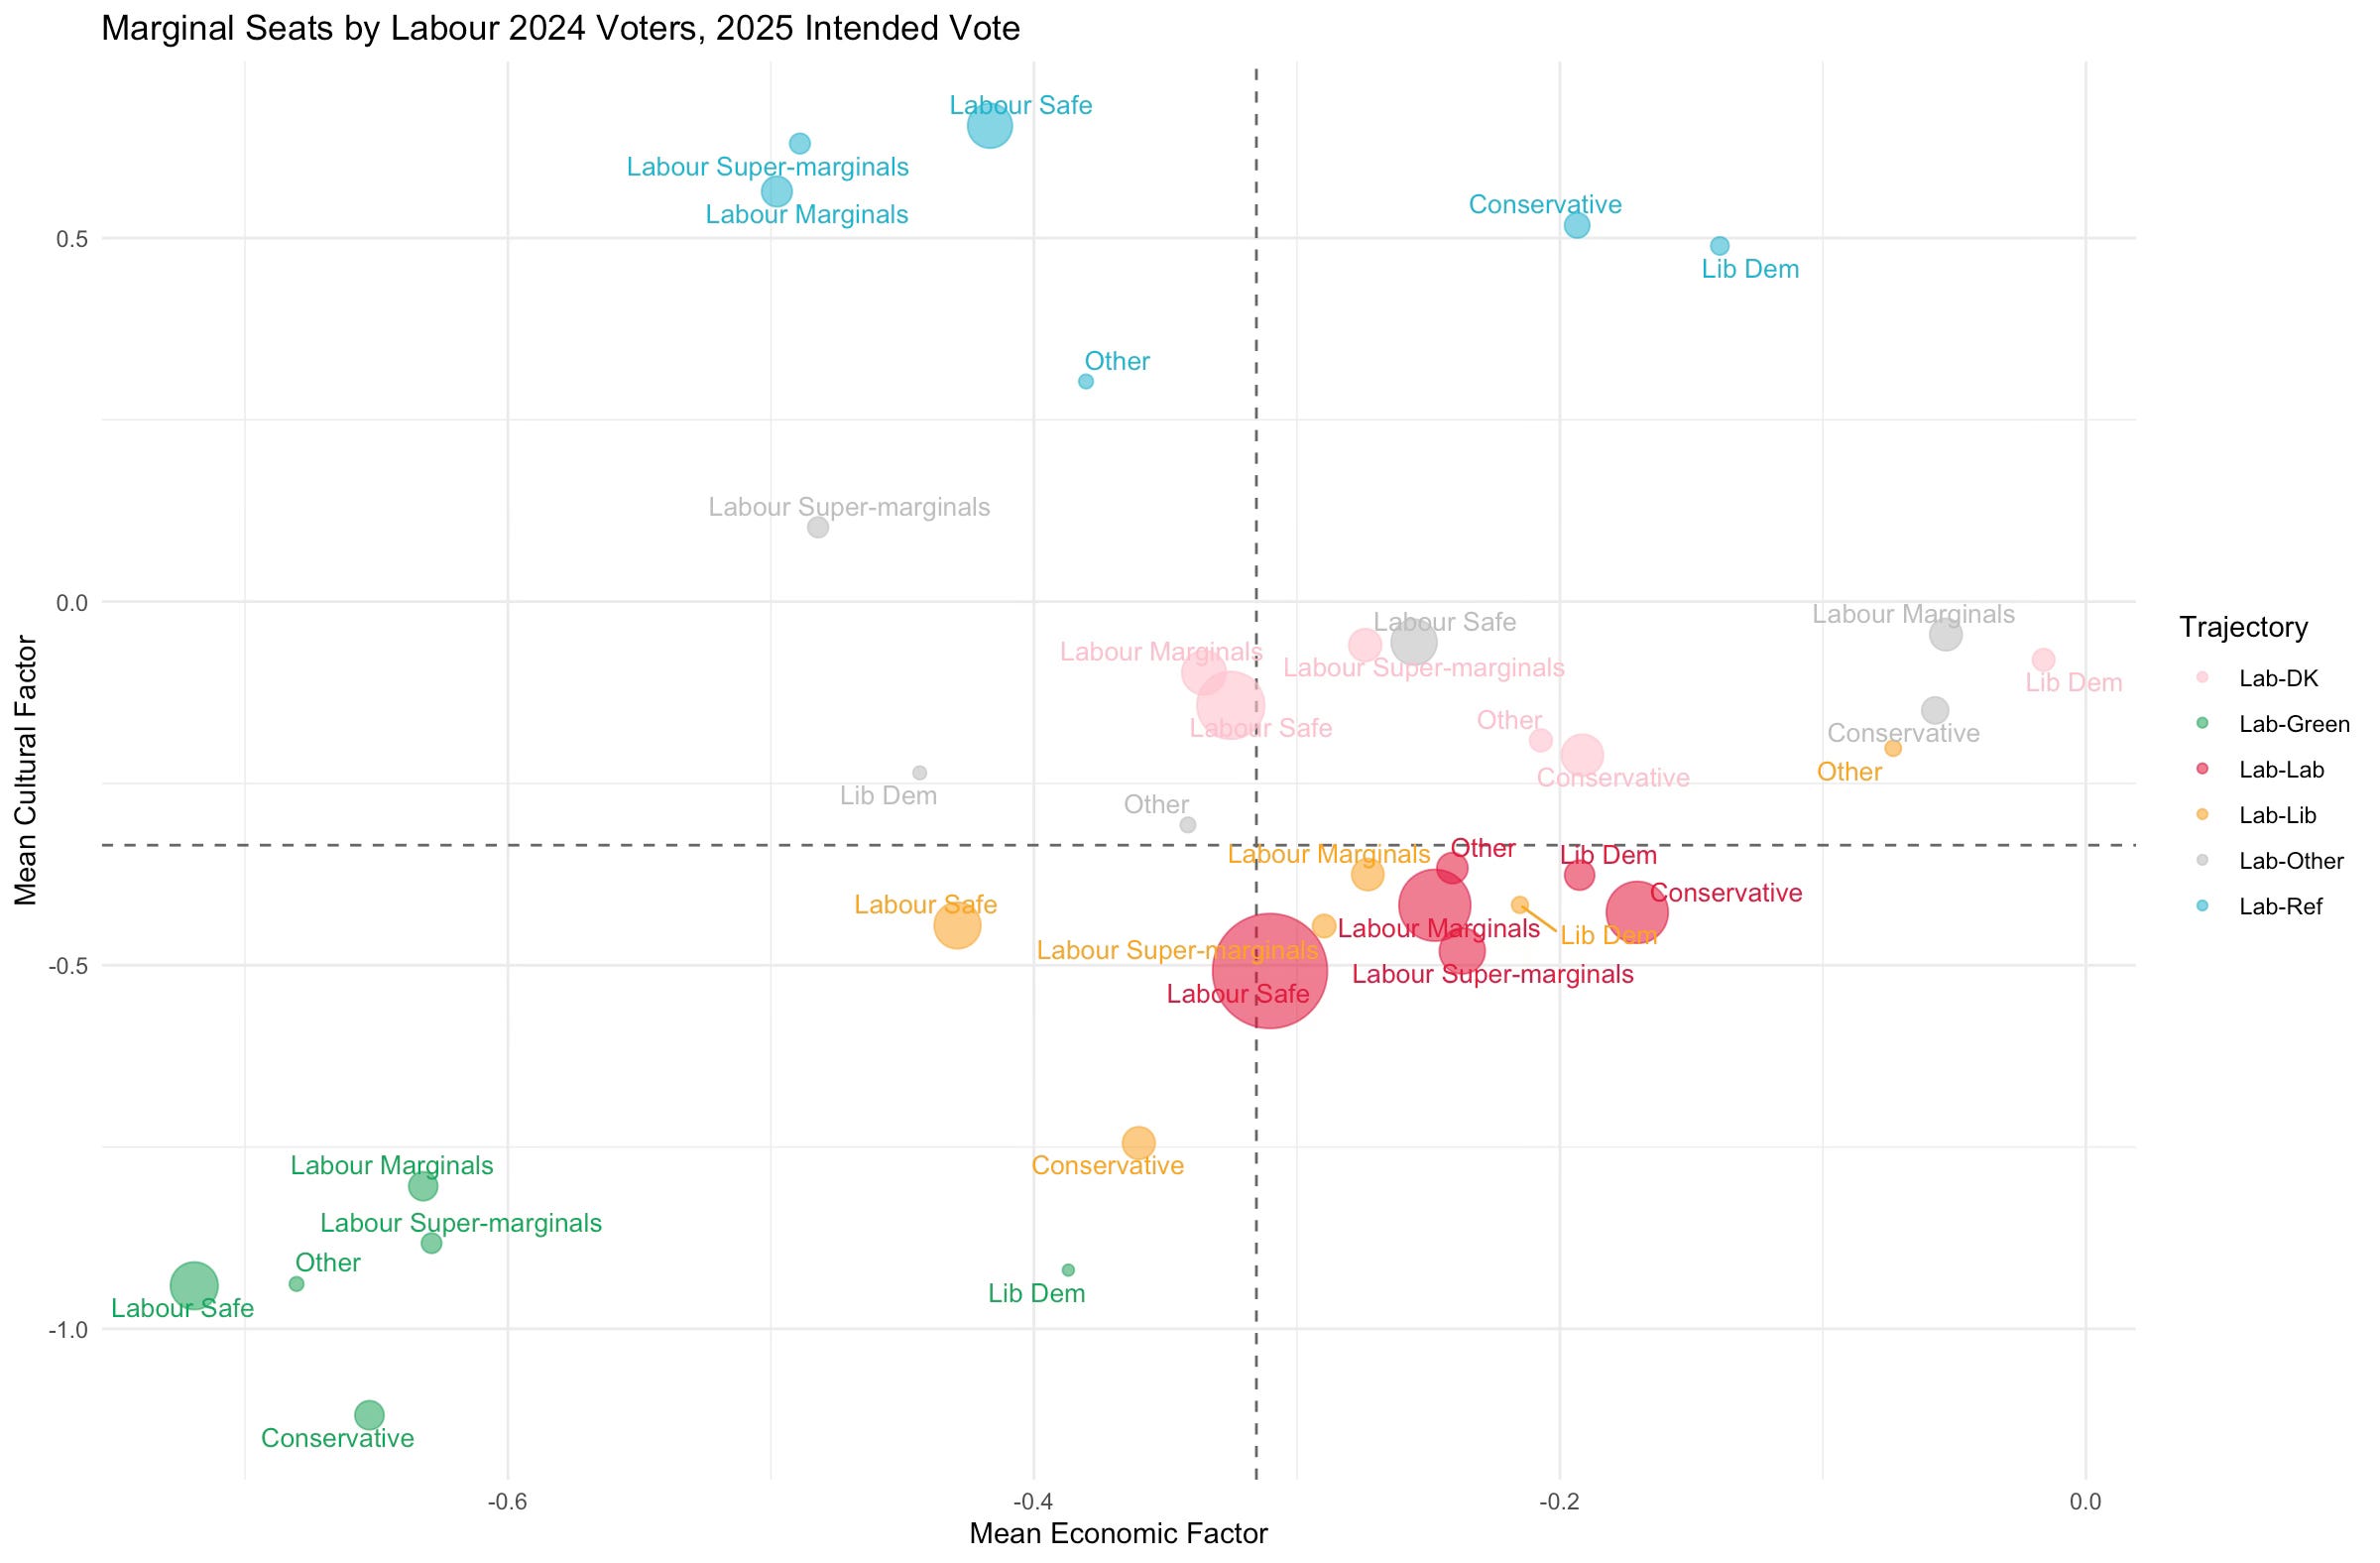
Well it looks pretty similar. People in Labour super-marginals are not really very different from people with the same vote intention in other types of seat. What matters is who you choose to vote for, not where you live. About the only outlier I can see is the very few people who are moving from Labour to Other, which is probably the Conservatives, in super-marginals. But that is a tiny tiny group. Indeed if you look at Labour losses to Reform, they are basically the same type of people in all currently Labour held seats. If anything Labour defectors to Reform in Safe Labour seats are the most socially conservative of all. We contain multitudes.
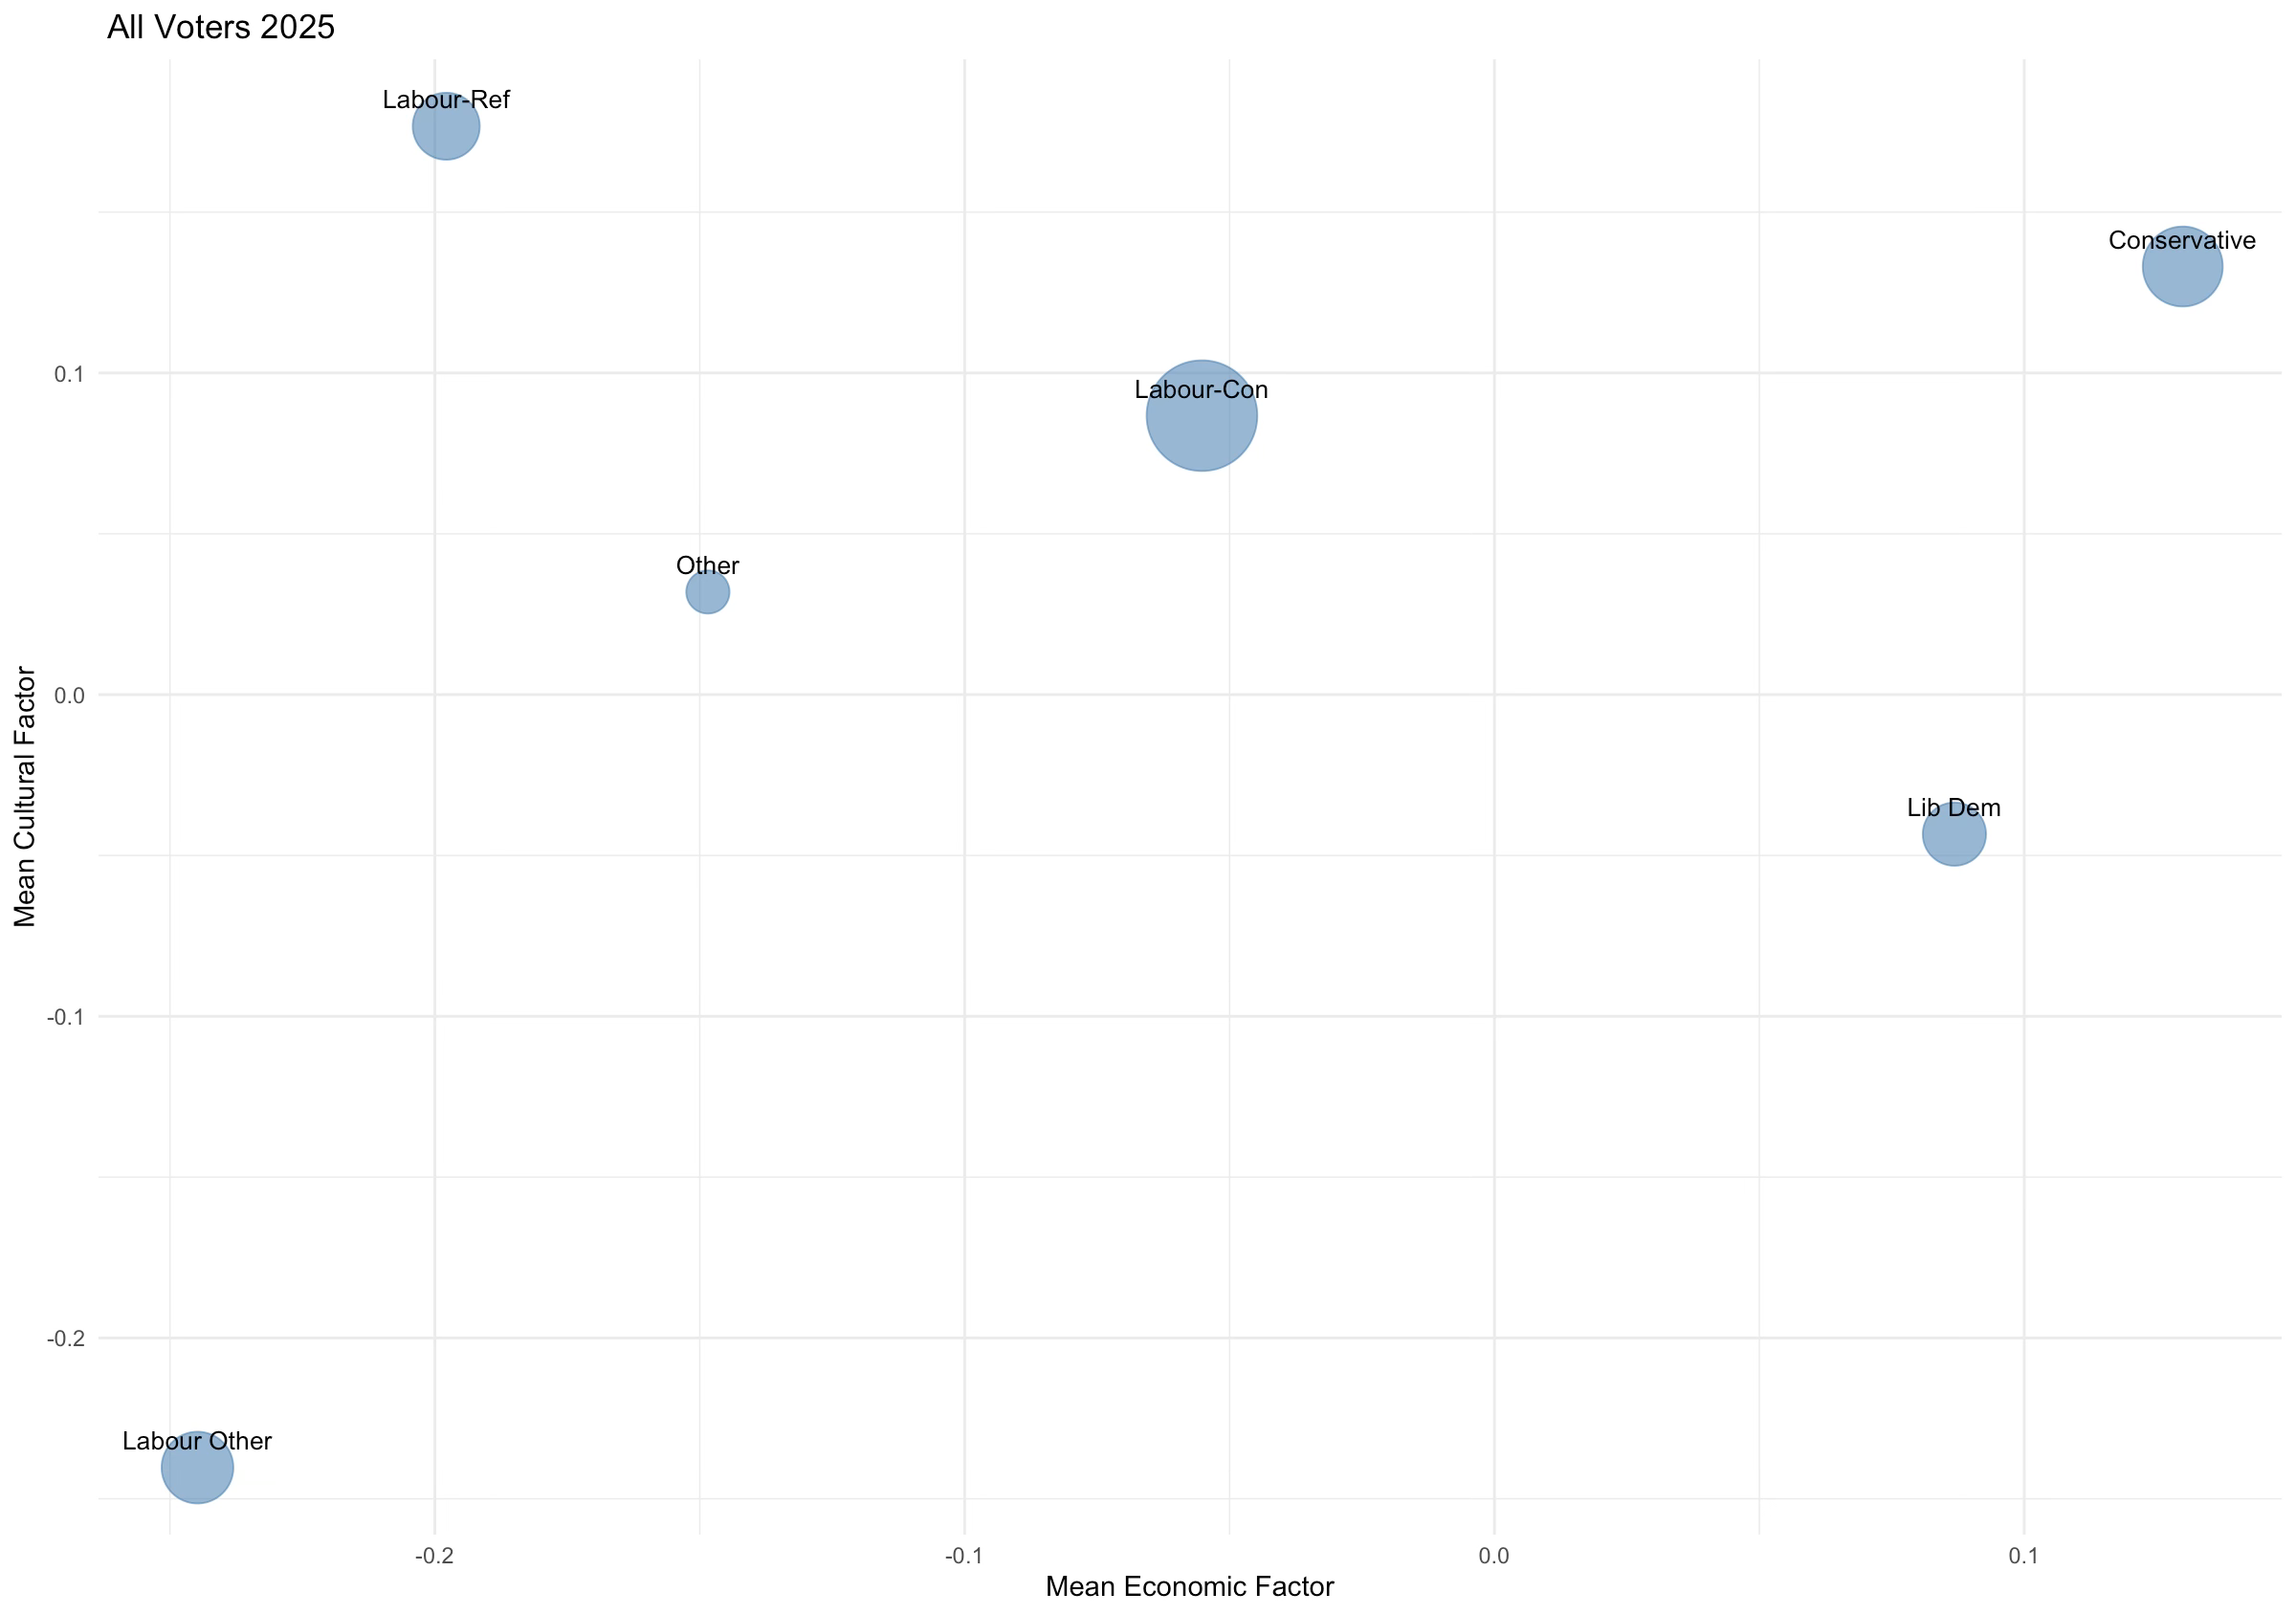
The same is true if we categorise constituencies by the runner-up to Labour.
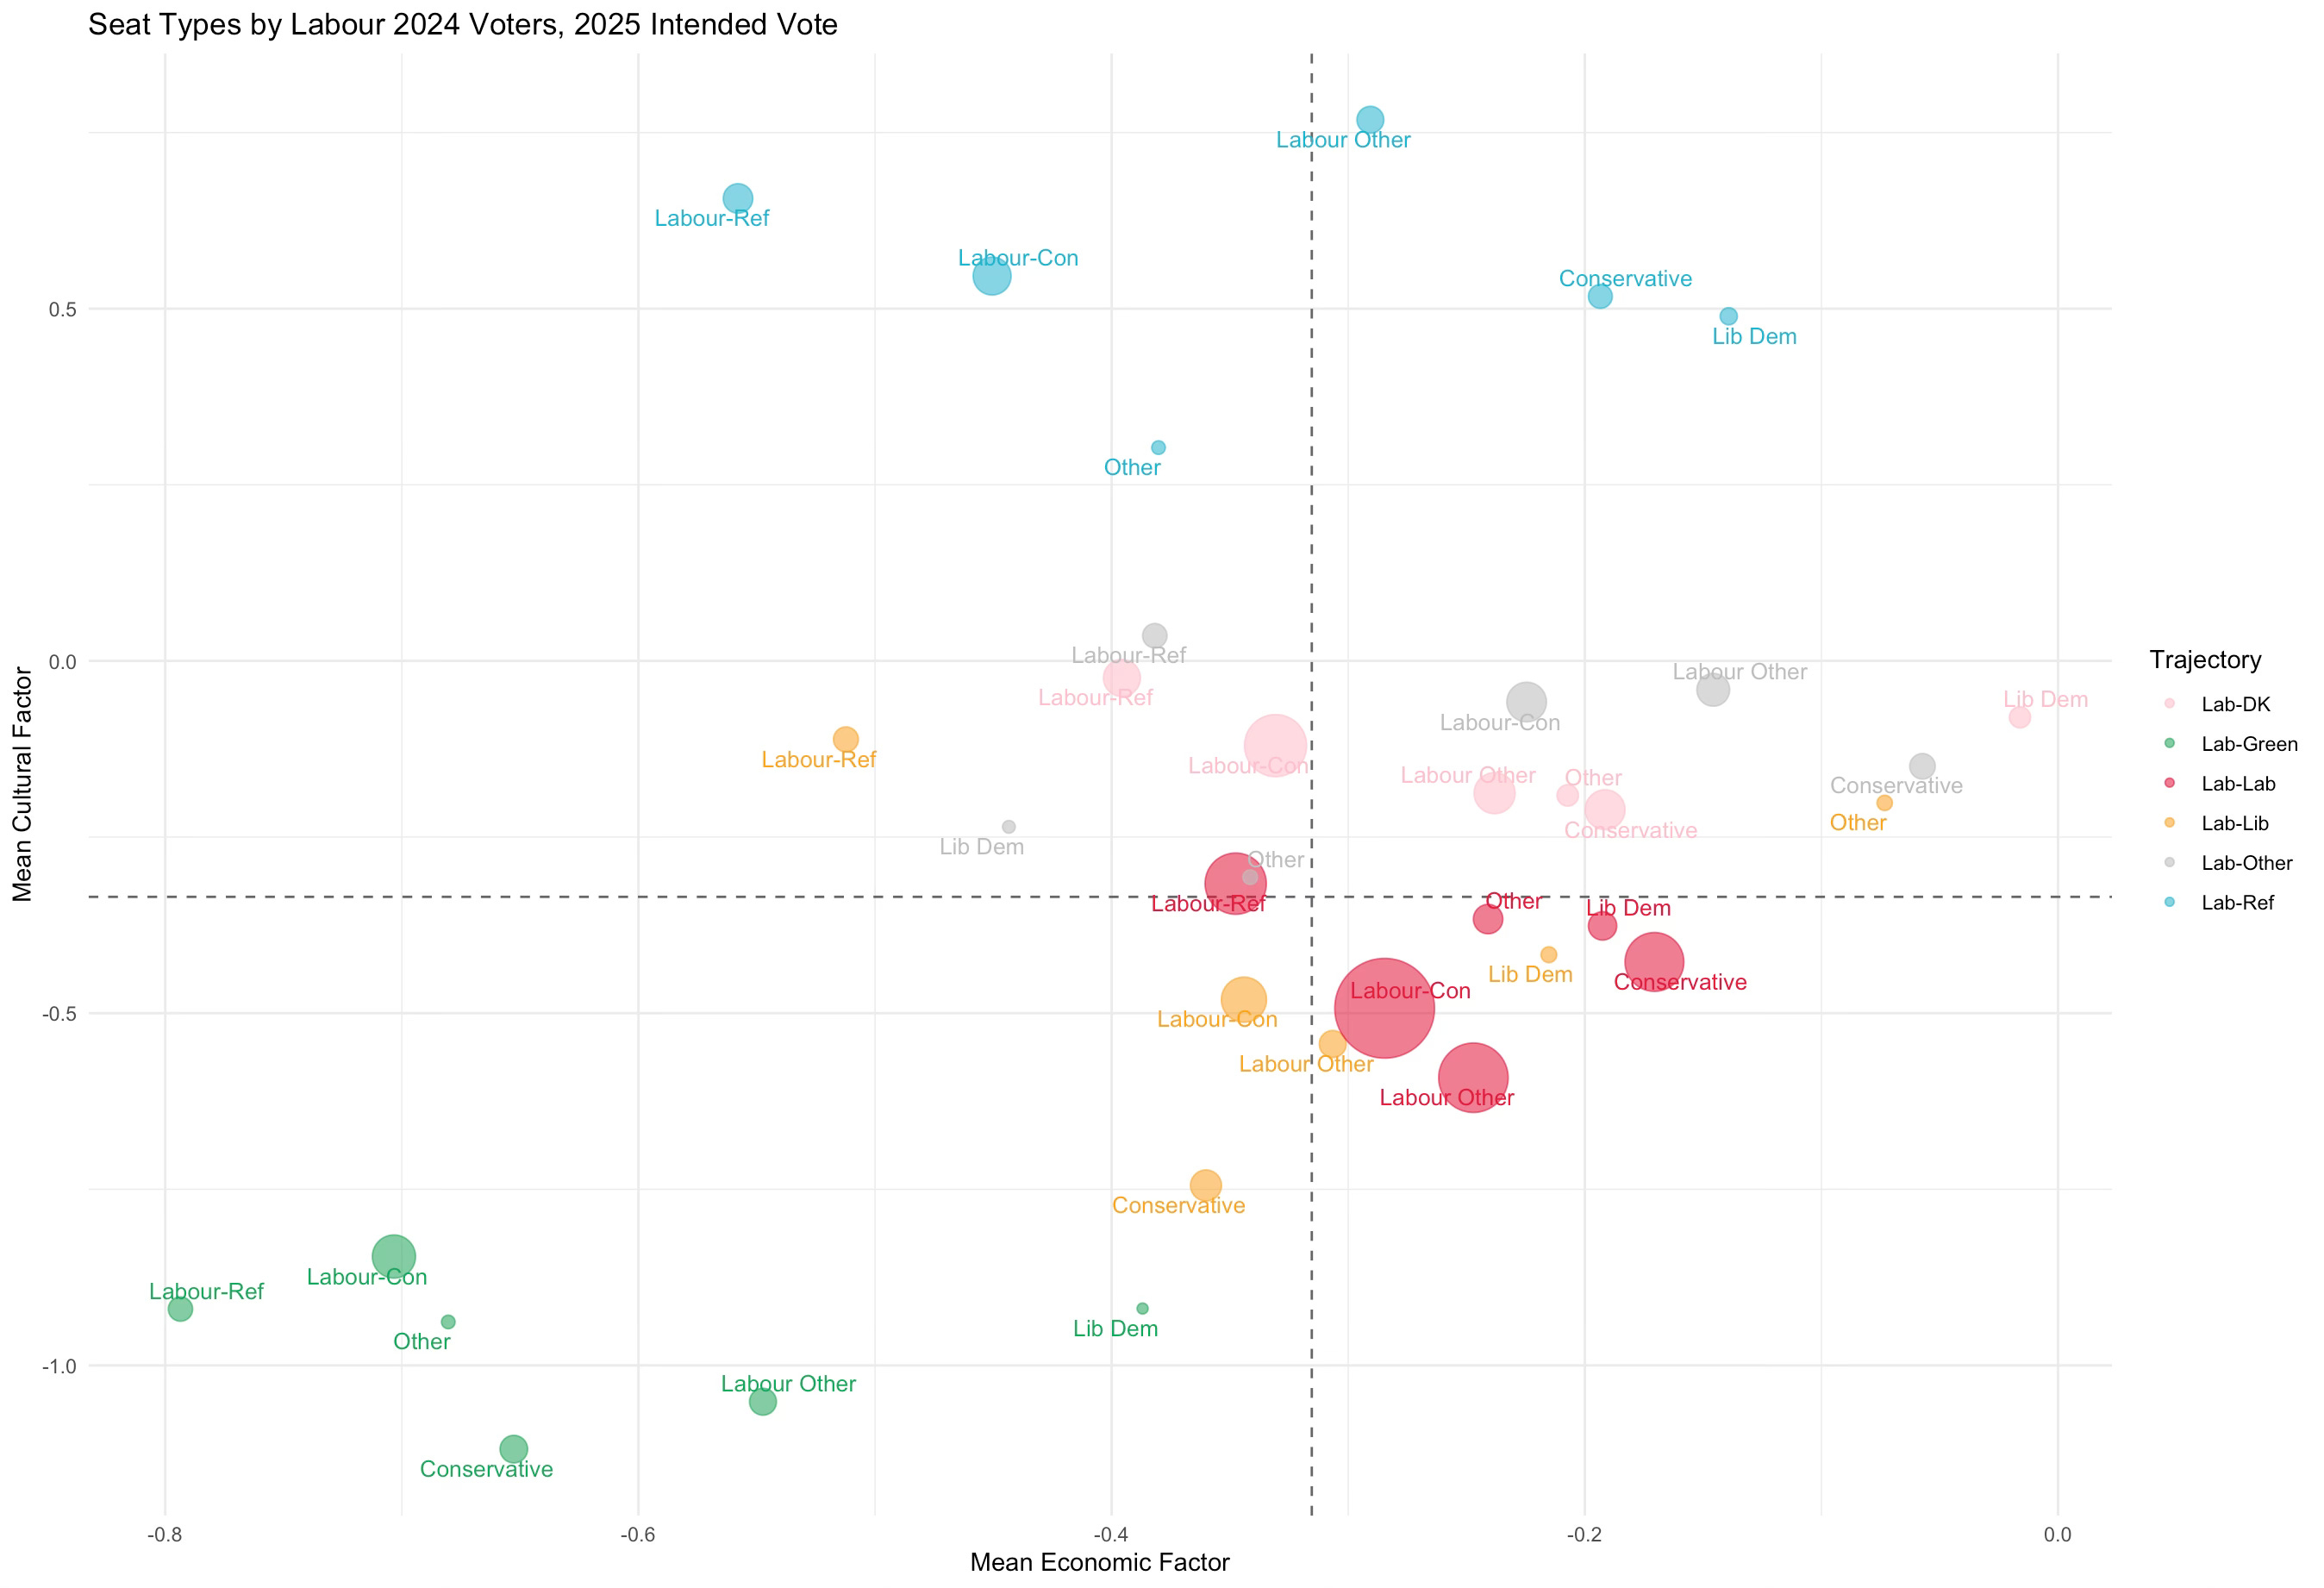
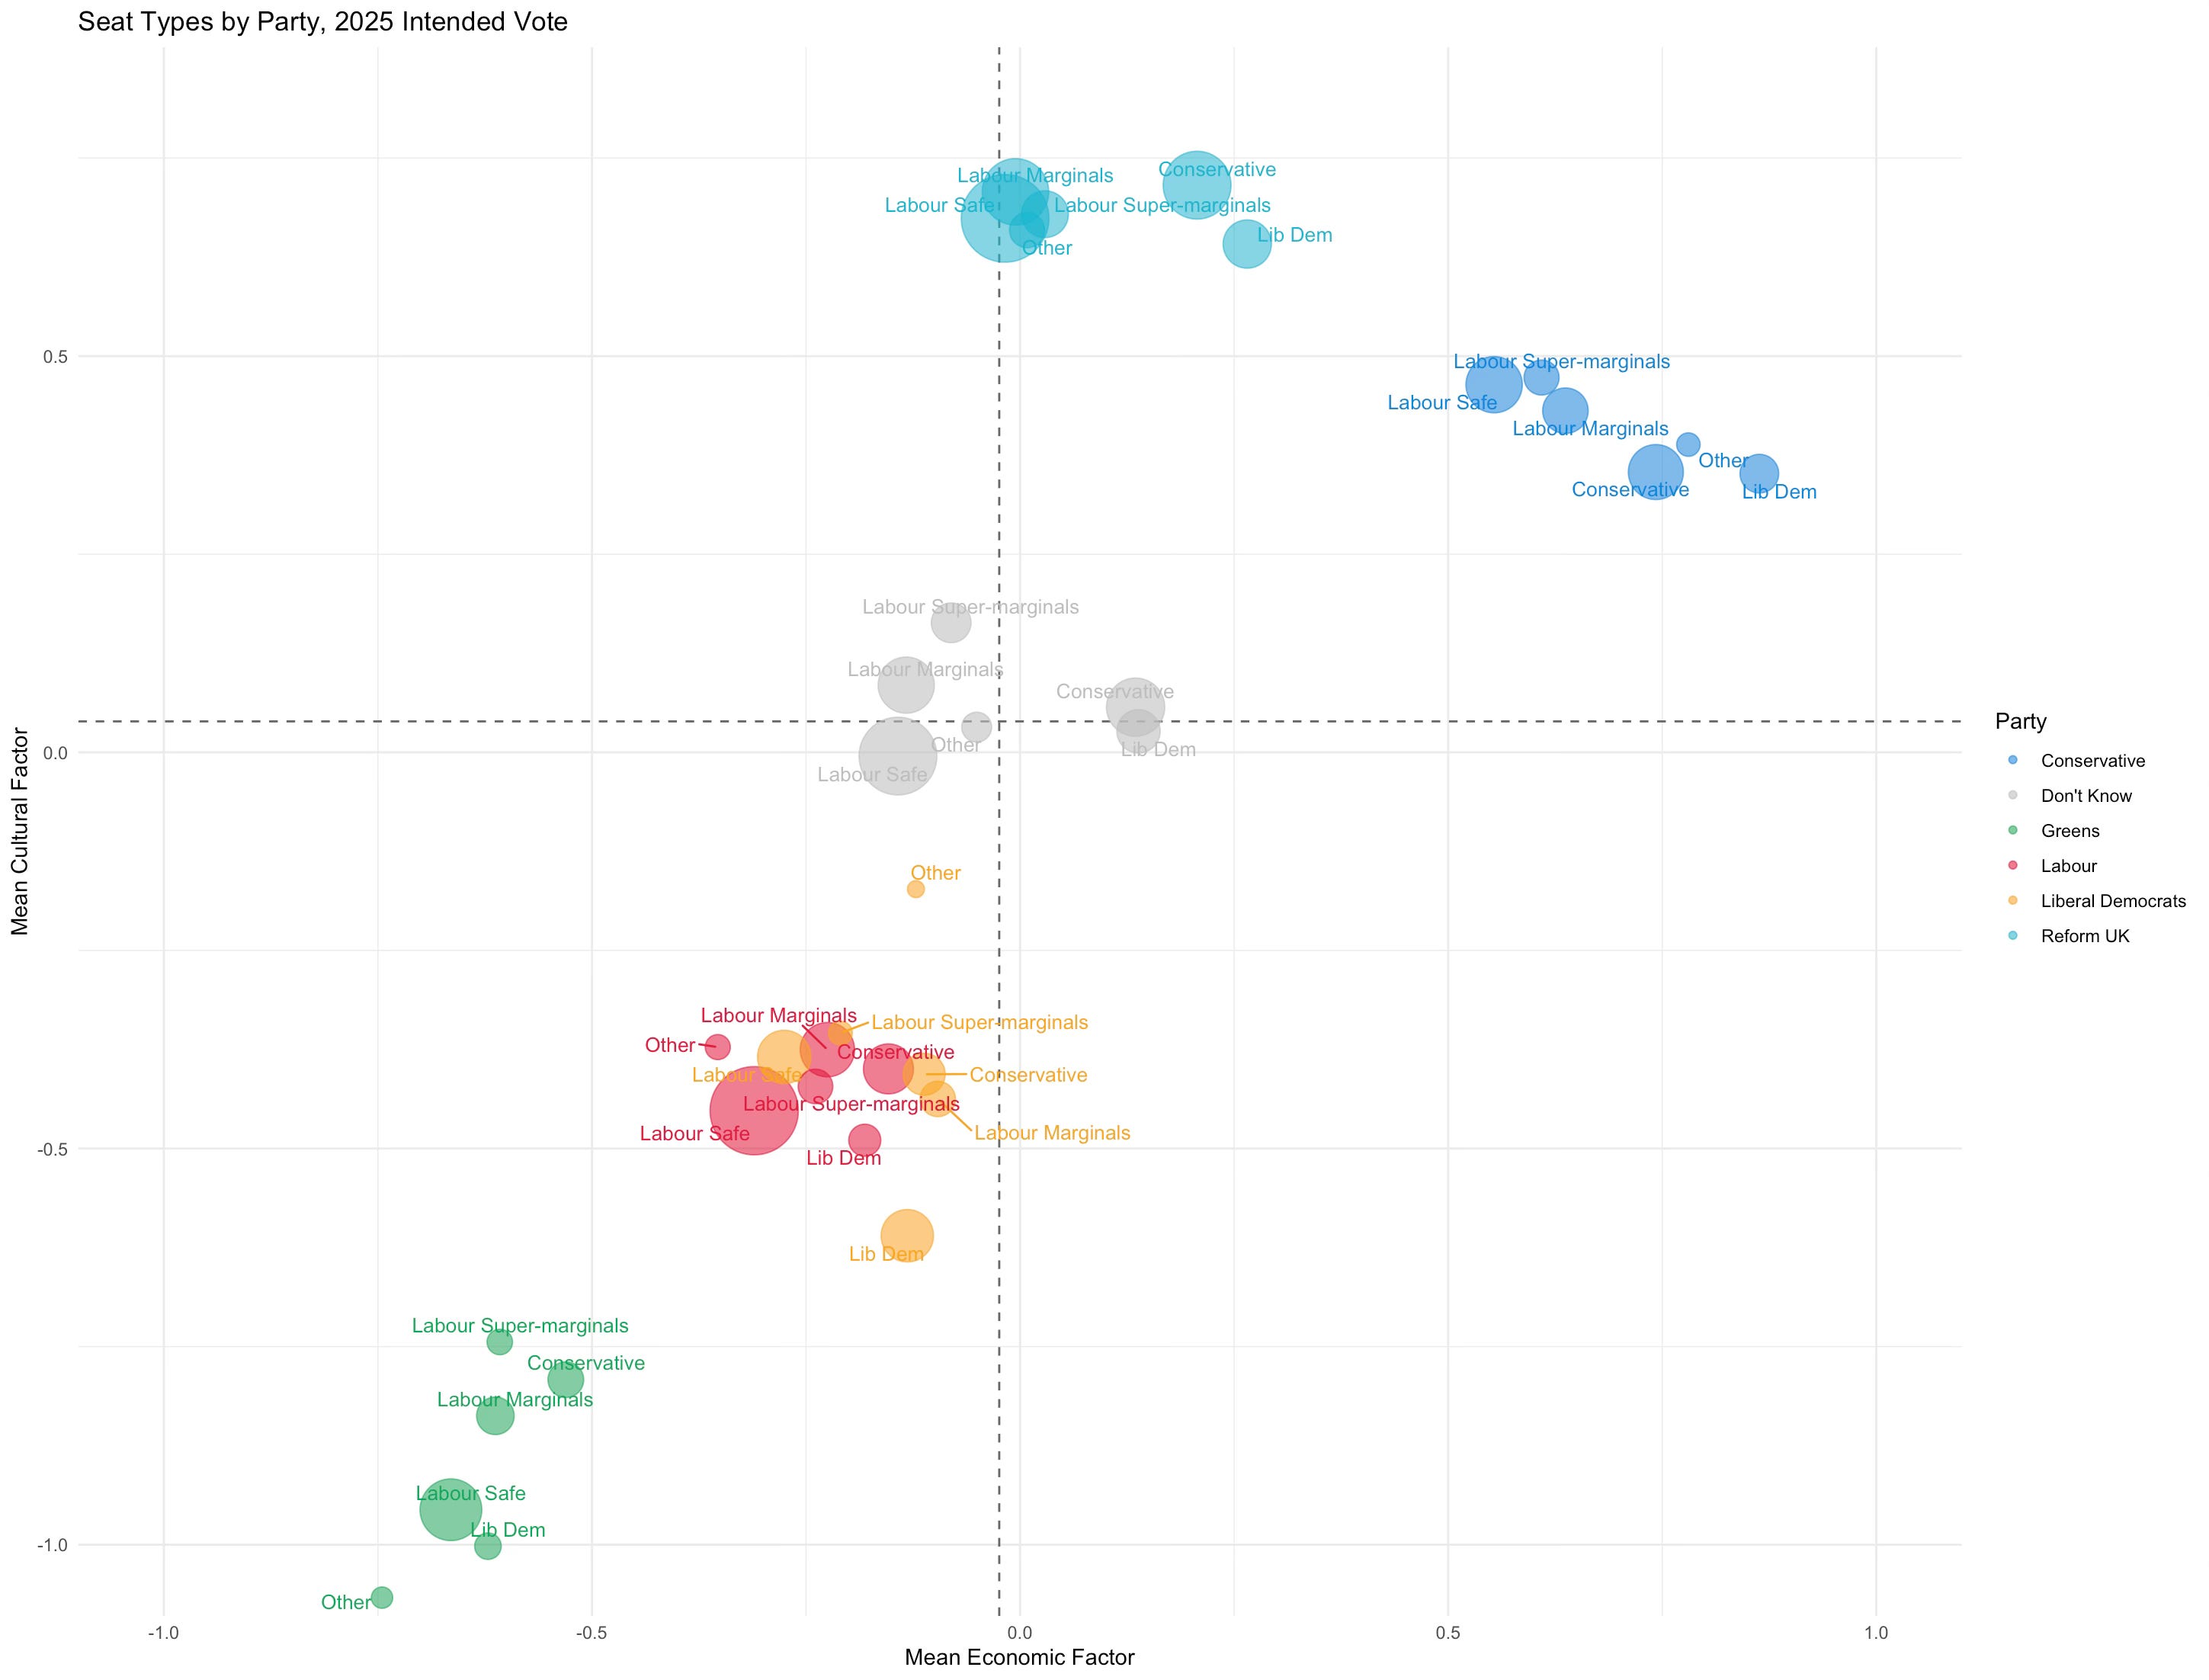
I recognise this one is rather hard to read - the labels mean the type of seat and the colours mean the type of voter. Lots going on I know. But basically the big differences across each constituency type among voters lie on the economic not the social dimension. In other words, Labour defectors to Reform are all socially conservative, but the ones in constituencies where Reform were runners up are much more economically left-wing than those in constituencies where the runner up to Labour was a non-rightwing party or where someone else won the seat.
So to put this again, people who remain Labour loyalists have pretty similarly left-wing attitudes (look at the averages with the dotted lines) regardless of where they live and to the degree they don’t they differ on economic issues not social ones. Same is true for defectors to Reform, or to Don’t Know, etc etc.
Where does is all lead to. Bluntly I think the McSweeney pivot has been a mistake. It assumes that Labour-curious voters in the marginals Labour needs to win are fundamentally different from Labour-curious voters elsewhere. And that social values are the key difference. That’s just not accurate. It’s true Reform voters and those who have defected from Labour to Reform are very socially conservative. But that’s not really related to where they live. It’s who they are.
The core group that Labour are most likely to win back are current Don’t Knows. As last time’s post and this one shows, these people aren’t enormously different from Labour loyalists. They are indeed slightly more socially conservative and slightly more economically right-wing. But they are not natural Reform voters. They are substantially closer to Labour, particularly those who previously voted for Labour.
It doesn’t matter where you live, or how politically salient your constituency is. The story is the same. Focus on voters and what they want. Put your hex-map of the battle for British politics away. This is not Risk, where you are placing all your troops in Indonesia or Kamchatka to defend at the margin.
The only margin Labour are currently at is the marginal of survival. By focusing on a few tactically important constituencies they are missing the overall strategy - govern well, govern clearly, and in the broad interest of your overall voting base.
There are 632 constituencies in GB, so if the BES are covering 630, they’re missing 2, with presumably 1 Labour.
In support of your thesis when James Kanagassooriam identified "The Red Wall" he did so by looking at the people who lived in a number of constituencies Labour held and noticed that their characteristics suggested that they would be expected to vote Conservative but did not. He did not start from an assumption that constituencies rather than characteristics of voters mattered.