How Bad Can It Get for the Conservatives?
The app is back. See if you can save the Conservatives! Or humiliate them. Up to you!
Remember last year that I produced an online app that allowed you to model tactical voting in the next election? Well it’s new and improved and now works on the new constituency boundaries, as well as allowing you to compare demographics by constituency.
And the million-dollar question, does this help the Conservative Party? A little but not much. Sorry lads. Read on to learn more.
Decline and Fall
The year is 2021. It’s been a tough eighteen months since the General Election - COVID has overwhelmed everything you wanted to do. To Build Back Britain, to truly Level Up, to climb the gleaming foothills. But you Got Brexit Done and the vaccine rollout means you are riding high in the polls, about ten points ahead of Labour.
And, what’s more, you have a trick up your sleeve. Britain’s parliamentary constituencies have become ever less reflective of the population distribution. Wales and Scotland and the North have too many seats, the Southeast, Southwest and East of England too few. Labour and the SNP are disproportionately advantaged by this distortion.
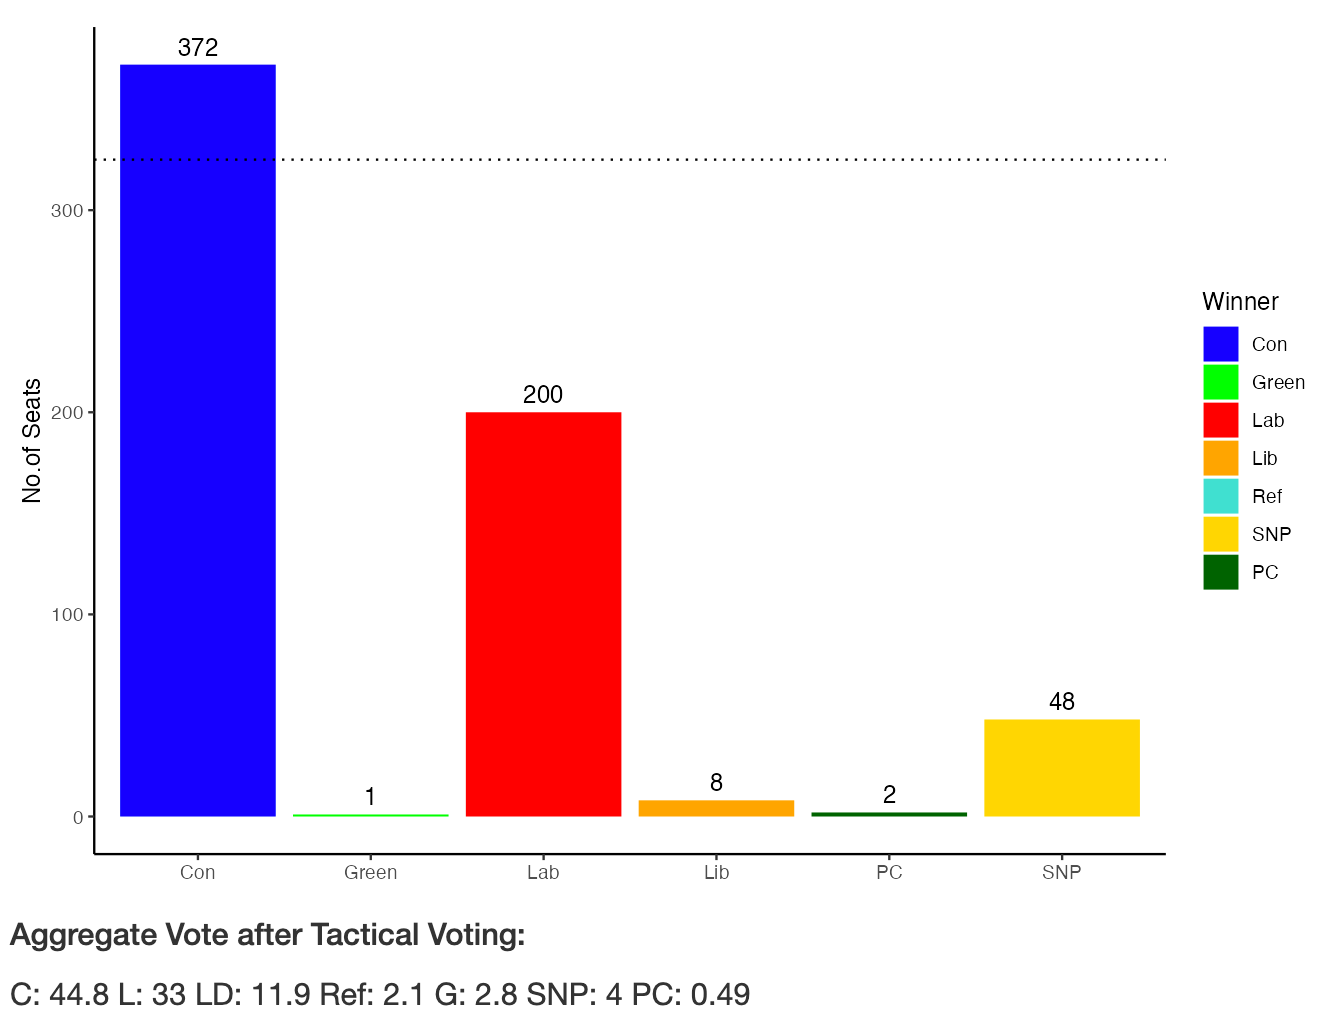
When the Boundary Commission finishes drawing up new boundaries for the next election, then you can stretch your lead even further. Your lead over Labour would have stretched from 365 to 202 on the old boundaries to 372 to 200 on the new ones. You are unstoppable and things are only getting better. Tally ho, my friends, tally ho!
And so to 2024… Scratch, freeze-frame. So, you’re probably wondering how I got here.
Well… terrible mistakes were made. The Boris bubble burst bathetically as a series of fatal personality flaws unravelled his reign. As 2021 rolled on and the emergency era of COVID was replaced by headlines about secret parties, the Conservative lead collapsed. By the end of the year Labour were five to ten points ahead in the polls - a lead they have never relinquished.
And you see, things can always get worse. As Johnson navigated early 2022 with the grace of a cow on roller-skates, it became clear to the public, and then to Tory MPs, that he could not continue in office. Conservative polling even recovered a little in the spring of 2022 as it became clear the party would engage in its usual healthy pruning exercise of regicide. I mean they can’t choose someone worse, right?
And yet.
The Trusstication (that’s one for Oxford people) of the Conservative Party had a seismic effect on polling. A ten to twelve point Labour lead became a twenty-five point one (37 points in one YouGov poll!) in a torrid few weeks in September and October of 2022 before Truss was exited stage right. Where she has remained to carp at Rishi Sunak’s government ever since.
Sunak did draw the polls back to a twelve to fifteen point gap. For a while. But the last few months have been fairly disastrous. Those twenty-five point polling gaps are back. And in the most recent YouGov national poll this January, the Conservatives had dropped to 20% support, with Labour on 47% and Reform UK on 12%.
And so, there is finally recognition - EVEN IN THE DAILY TELEGRAPH - that the Conservatives are very unlikely to be the winners of the next General Election. Of course, the election campaign has not begun and there are almost certainly large numbers of Don’t Knows who will hold their nose and vote Conservative on election day, particularly if the press can fashion up a good old ‘Labour’s tax bombshell’ campaign.
The turning point appears to have been a recent YouGov MRP (different to the national poll just above) that was commissioned for the Telegraph - meaning that a readership who have been a little blithe perhaps in assuming continued Conservative government are suddenly biting their nails. Oh well lads, at least you haven’t been running an echo chamber for the last few years.
Ironically, the implied national vote percentages from the MRP look pretty good (relatively) for the Conservatives. Labour are kept just under forty percent and their lead is 13.5 percent. Big but not insurmountable. What looks rather less rosy is the implications for seats in Westminster. The MRP gives Labour a 120 seat majority, with 385 seats to the Conservatives’ 169.
Now if you plug the poll numbers into most election calculators you don’t get a seat difference anywhere near that large. So something is going on. What is that? Very high levels of tactical voting.
And you know who produced a handy tactical voting app last year? Yours truly. I even wrote a couple of Substack articles about it, here and here.
But the problem with the last app was it was based on the old electoral boundaries. And you may recall that the new ones favour the Conservatives. Will the new boundaries save them? Not really. But they might prevent a Canada 1993 style disaster for the Conservatives, giving them something more like a Michael Foot 1983 or more likely a Ramsey Macdonald 1924 outcome. Which makes Keir Starmer the new Stanley Baldwin. Which feels kind of right to me.
Sometimes you hit the boundaries, sometimes they hit you
So I promised an app. Here it is. It is similar-ish to the last one I made but with all kinds of exciting new features. The first, and most important, is that it now lets you see what national polling (and changes to tactical voting) mean on the new constituencies that will actually be used in the upcoming election. You can also compare to the old existing ones. And to what would happen if we had proportional representation, should you be inclined to commit electoral system treason.
I’ve been able to do this thanks to the new estimates produced by Colin Rallings and Mike Thrasher (check your postcode here). You can compare seat numbers in a bar graph, or in a scatter comparing the Conservative lead in 2019 to estimated Brexit vote (thanks to Chris Hanretty), or in a hex-map (thanks to Philip Brown and Alistair Rae). You can even look at how predicted votes in the new constituencies compare to their age, religious, ethnic, and home-ownership demographics (thanks to the House of Commons library). So lots to muck around with. But let’s begin at the beginning.
I mentioned right at the start of this piece that had the new boundaries been in place in 2019, the Conservatives would have had an even larger majority. And you can see this pop right out of the app. Here are bar charts comparing new and old constituencies.
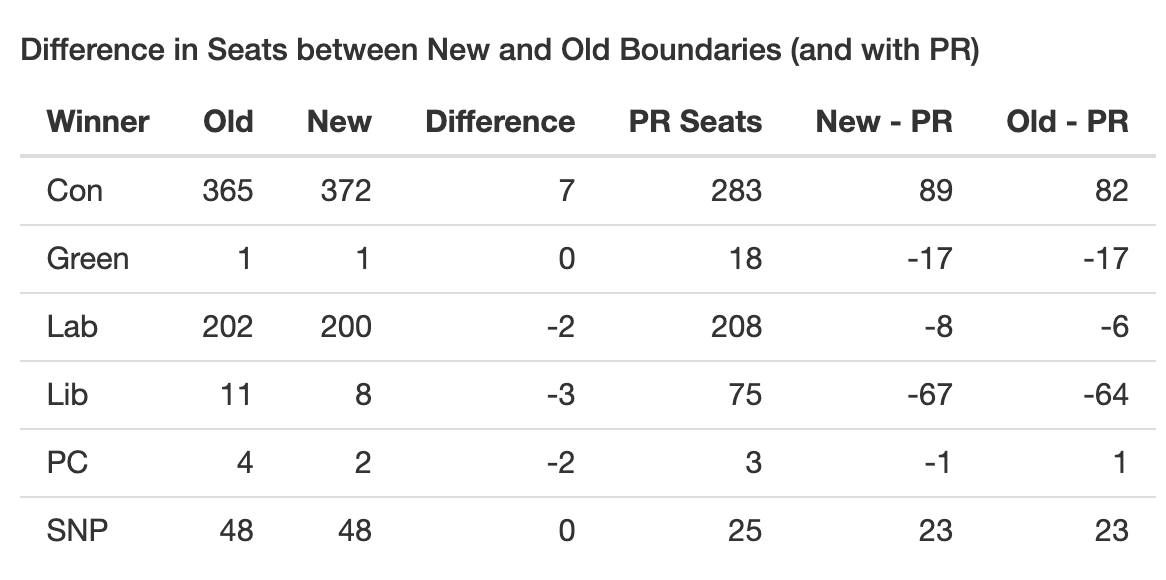
You can see the Conservatives would have had seven more seats, Labour two fewer, the Liberals three fewer, and Plaid two fewer. This is because Wales lost EIGHT seats with the new boundaries and most northern regions and Scotland lost a couple each. The winning regions were the Southeast (seven more), Southwest (three more), East (three more) and that there London (two more).
Below the figure you will see a table that compares each party’s seats on the new and old constituencies (as well as to what would happen if we had a completely proportional system, or indeed one that was a multi-member system for each region as with the EU elections - basically the same as proportional it turns out). Here it is for the 2019 vote shares. I should note that the Brexit Party would have got thirteen seats - they just don’t appear in this table because they didn’t win any seats in FPTP.
The table makes clear the relative advantage that the Conservatives have with the new boundaries. It also shows just how incredibly disproportionate our electoral system is. What is perhaps more surprising is that the new boundaries make our system even more disproportionate than the old ones - at least on the 2019 vote share. This feels paradoxical because the new boundaries are fairer - they are closer to equalising the importance of everyone’s vote across constituencies. But somehow our electoral system makes even fewer of these more equal votes count. The enigma of 2019.
But look, 2019 has been and gone. What about now? Well, now we are talking about a very different world of polling. The average of new polls, which I am taking from the friendly folk at Election Maps UK is Cons 25.4, Labour 43.6, LD 10.7, Reform 9.9, Green 6.3, SNP 3.2, Plaid 0.7. And if we plug this into the new constituencies we get the following outcome:
And we have the following comparisons to old boundaries and PR.
A few things to notice. First off Labour have a comfortable majority, similar to that received by Boris Johnson in 2019 when he squatted like the proverbial giant toad across British politics. Does Keir Starmer squat like a toad? Read Tim Shipman’s latest to find out…
Second, we see a decline from 2019 in the SNP and a rise in the Lib Dems so that they are similarly sized parties in Westminster.
Third, and perhaps most surprising. The new boundaries are pretty helpful to the Conservatives - they save them fifteen seats. So that’s double the effect of 2019. The boundary commission is basically a life raft for the Conservatives. Now 197 seats is still rubbish. It's worse than either Corbyn or Michael Foot got. But it’s a lot better than 1997 was for the Conservative Party where they had just 165 compared to Labour’s 418. So if this is the outcome, it makes Starmer a Boris not a Blair.
But you remember I said this is a tactical voting app. In previous episodes of this Substack I have remarked that thirty percent of Lib Dems moving to Labour in districts where Labour is the second party and vice versa, is a reasonable guess. I also do this with Green voters (I am less certain of this tbh since I think people voting Green might be voting against Starmer rather than against the Conservatives). Note this shifts the final aggregate polls from what we initially put in (I assume that people are giving sincere views today but vote strategically on election day).
<Health warning for Lib Dems> the tactical voting works by building off who did better out of Labour, LD, Green in 2019 and allocating all progressives to them. This might not concur with your views on who is best positioned to win the that seat this coming election. Yes, I agree. But simple assumptions are better IMO than me picking through each seat and making guesses.
What happens then? Well it’s not good for the Conservative Party.
Oof. That’s not quite Blair 1997 level for Labour (the SNP keeping a ton of seats) but it’s good for the Lib Dems and it’s very bad for the Conservatives. This is Keir Baldwin territory. Or rather Rishi MacDonald, since Ramsey McD’s Labour Party only got 151 seats in 1924. Again, the new boundaries prevent this from being even more embarrassing for the Conservatives, who would have just 131 seats in old money.
But what about those ten percent of people going for Reform UK? Let’s say Rishi can win half of them back by STOPPING THE BOATS. Well here’s what you get when you have tactical voting in both directions (30% Lab/Lib/Green; 50% of Reform going Conservative).
OK, that looks better! It gets Conservatives back to where they would be if there wasn’t any progressive tactical voting. But it’s still pretty terrible. Less terrible than the old boundaries, where they would only have 174 seats. But still sub-200.
And it can get worse. Yes it can. Shocked Dall-E Rishi Sunak creation in the image heading this piece is looking at the worst poll YouGov have produced, from the 17th of Jan this year: Con 20, Lab 47, Reform 12, LD, 8, Green 7, SNP 3, PC 0.7. OK what does this look like with no tactical voting, progressive tactical voting, and both ways tactical voting. Behold:
That’s quite bad really. Worse than any Blair era outcome. In fact worse than any post WWI election other than 1931 (after MacDonald’s betrayal and the formation of the National Coalition). But we can make it worse… Just add a little progressive tactical voting.
Under 100 for the Conservatives - in a near-tie with the Liberal Democrats for His Majesty’s Most Loyal Opposition. Could be worse though. Under the old boundaries, the Liberals would have had seven more seats than the Conservatives. So Sunak can thank the boundary commission for that. Long story short the boundary changes have made an awful situation a bit less awful. Huzzah!
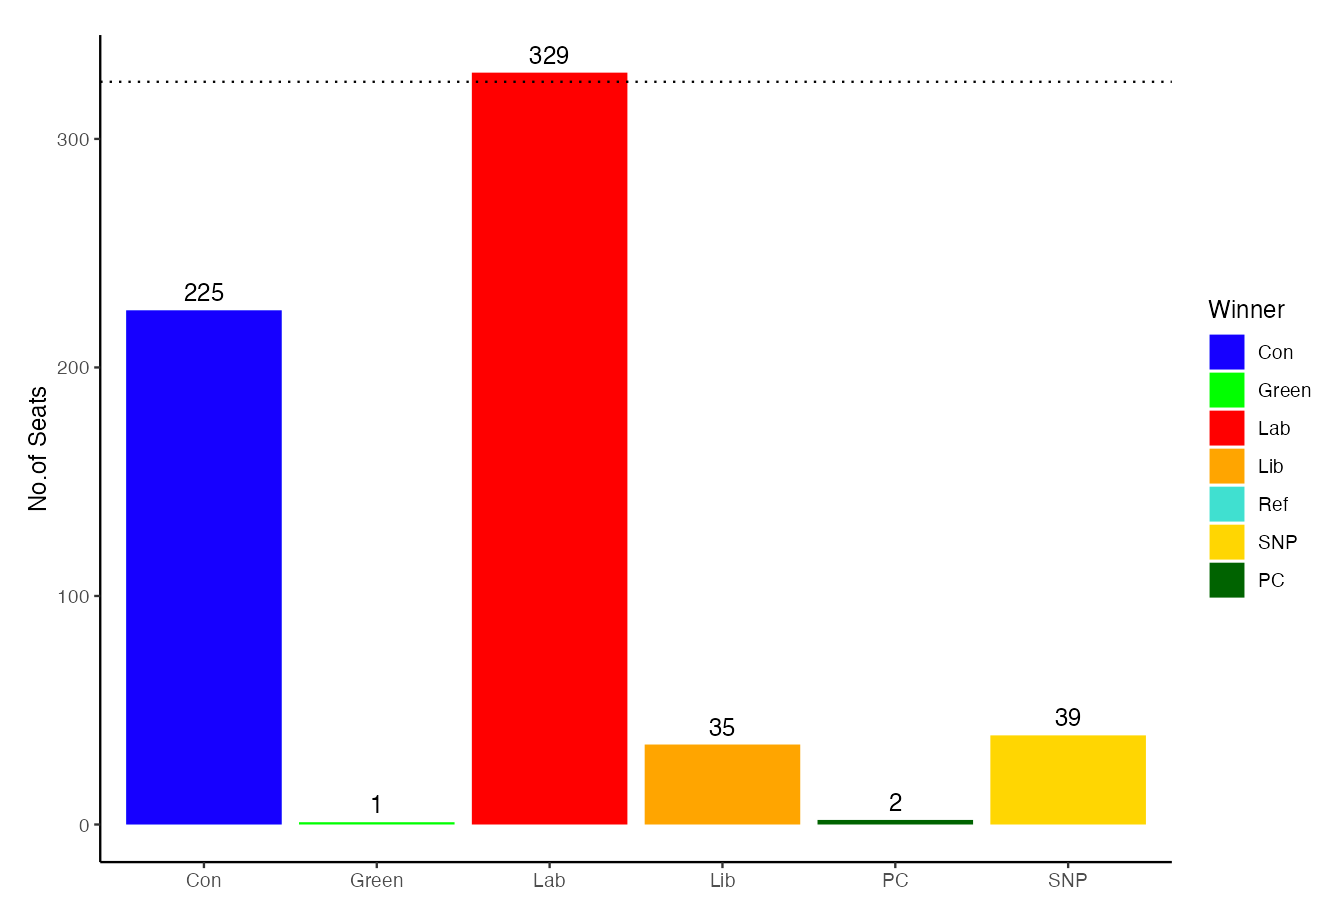
OK that all looks rather terrible. But there was a different YouGov poll. The MRP one that gave the Telegraph the willies. And actually the topline national vote estimates for that looked… not as terrible: Cons 26, Lab 39.5, LD 12.5, Ref 9, Green 7.5, SNP, 3, Plaid 0.5. So if we plug this into the app we get… well actually we get something rather different to the MRP, which is interesting.
So in a very simple Uniform National Swing (UNS), those national numbers would give you a very thin Labour majority. It’s still pretty lousy for the Conservatives but it’s generically lousy. Kind of Labour in 2015 lousy. Meh. But wait you say. The YouGov MRP had much worse seat numbers for the Conservatives. It did, they had just 169 seats to Labour’s 385. And the Liberals did better in the MRP than the UNS - 48 vs 35; and the SNP did worse - 25 to 39. So what does that mean?
It means that people are indeed voting tactically if the MRP is accurate. The only way to get those seat numbers from those polling numbers is if lots and lots of Lib Dems and Greens are voting Labour and lots of Labour are voting Lib Dem (sorry Greens). And this hurts both the Conservatives and the SNP massively.
Now I have tried a few times to see if I can recreate the YouGov seat distribution with my app and basically I can’t. Sort of. I can get the exact same number of seats for each party if I jiggle around the tactical voting (here’s a fun example: use national vote shares of C:26, L:42.37, LD 8.3; R 9; G7, SNP 2.75, PC 0.9 and then move the progressive tactical vote to 0.35). But when I compare the particular seats, my predictions and YG’s are quite different - we disagree on 67 seats, which is quite a few. And I can’t get the aggregate vote share post tactical voting to add up to the same numbers.
A couple of things explain this. First, I assume that Labour, LD and Green voters behave in the same way - a proportion (set by the tactical voting slider) all back whichever of those parties is in the lead. But that won’t really happen. First because LD and Green voters won’t dash to Labour where Labour already have a large lead (what’s the point?). And second because they won’t behave symmetrically. Essentially to get the YG polling aggregates and have their seat distribution you have to have a lot of Labour supporters voting Lib Dem and rather fewer Lib Dems and Greens returning the favour. Otherwise Labour would have much more than 39.5% of the vote.
So my model is probably not quite right - there’s more variation going on than my simple sliders can handle. People are differentially likely to tactically vote in certain areas and the MRP has enough respondents to pick that up. Of course this implies that if the real national polling is worse than L39.5, C26 then the Conservatives are in even more trouble than they thought.
Anyway the message from this is that strategic voting is complex and there are a bunch of different ways it could happen. But any progressive strategic voting is bad for the Conservatives - it could just be worse than my model predicts. And getting Reform voters back helps a little but not a lot. The new boundaries also help. But not nearly enough. So is there anything they can do?
Sunak or Sunk?
My autocorrect regularly corrects ‘Sunak’ to ‘sunk’ and this appears to be an ever more helpful suggestion (certainly more so than ‘Keri Starter’). What can the Conservatives do? I suppose they could defenestrate Rishi Sunak in the hope that a prince across the water (the water being the Thames, and the prince currently living near Wallingford in South Oxfordshire) could save them. Or that perhaps one of Suella Braverman, Kemi Badenoch, James Cleverly, or let’s just have fun with this Lee Anderson, Miriam Cates, or Danny Kruger, could save them. Maybe I suppose. But this plan has not worked wonders heretofore.
So let’s assume the party keep the PM - which I think is a 95% probability - what can they do to get closer to keeping a majority or at least not have an embarrassing disaster? Well we have already seen one thing - win back some Reform voters. That does indeed help. It’s not a mad plan. But the danger is that everything that you do to attract Reform voters loses you Lib Dem voters and then the tactical voting goes the other way and you are back in trouble.
That’s why I think the pivot to socially authoritarian policies - like the obsession with the Rwanda policy - doesn’t really help. The policy likely loses as many people to the left as it gains to the right. IMO the Jeremy Hunt strategy is smarter - find ways to scare Liberal Democrats away from Labour and keep Reform voters happy by promising tax cuts / claiming Labour will raise taxes. Unlike Rwanda this has the merit of being feasible logistically, not blockable by the Lords, and possible before the next election. Do Reform voters care as much about tax cuts as they do about illegal immigration - probably not. But a failing Rwanda policy doesn’t seem to be working to keep them on side anyway.
To get a sense of where Conservative support lies - what aspects of constituencies seem to matter most - I have added an exciting new tool to the app, which allows you to compare various constituency-level demographics to the predicted vote for each party produced by the app. Now since the app is mostly UNS, you won’t change the look of the scatter plot enormously by shifting the vote intention sliders - the plot will basically just move up and down. So the more important part is the baseline relationship with demographics. And demographics are very very telling about where the Tories will focus their campaign.
OLD. WHITE. HOMEOWNERS.
Allow me to demonstrate. I’ll use the current polling averages as our baseline and plot Conservative vote against age over 65, percentage of White British ethnicity, and percentage of households who own their house outright. Let’s start with age.
There is a very strong relationship between the age of the population and still voting Conservative. The Conservatives still win, even under current polling, the seventeen constituencies with the oldest populations. And they don’t win anywhere that has a 65+ population under ten percent.
The Conservatives are also almost completely dependent on constituencies where more than three quarters of people are of White British ethnicity. Labour are likely to win lots of these constituencies too but they are also win every constituency in England and Wales where White British is a minority. (Note that does not mean white is a minority - there will be lots of White Irish and White Other in these constituencies).
Finally, the Conservative Party is the party of homeowners - specifically those who own their house outright (the picture above). Notice that under current polling the Conservatives would not win anywhere where fewer than twenty percent of households own their house outright. And their real strength lies in places where a third to a half do (with Labour much weaker there).
So we should expect a Conservative campaign focused on keeping these places and winning places that look like them - there are after all lots of old, white, home owning constituencies that are currently predicted to go Labour. Of course the Conservatives could seek the votes of younger, non-white, renters. They could. And they did in 2010 (and maybe 2015). But let’s be honest here - they have emphatically not cared about doing so systematically for the past seven or eight years.
What do Conservative voting (or curious) places like? Stuff that older, whiter homeowners like: low taxes but support the NHS, keep houses prices high, and lots of culture war bumph - getting irate about Rwanda, trans-rights, 20 mph speed limits, 15 minute cities, and the general transcendent spirit of the wokeness. So that’s what we will get in the campaign. Pass the popcorn Wagon Wheels.
The demographic scatterplot-maker is also helpful to look at where is likely to vote Labour, again, if today’s polls stand.
Private renters generally vote Labour. Everywhere where more than thirty percent of households rent privately votes Labour (or for Caroline Lucas). One would assume that if anyone is going to do anything about the state of the British private rental market it would be the incoming government. Though this is the British housing market we are talking about…
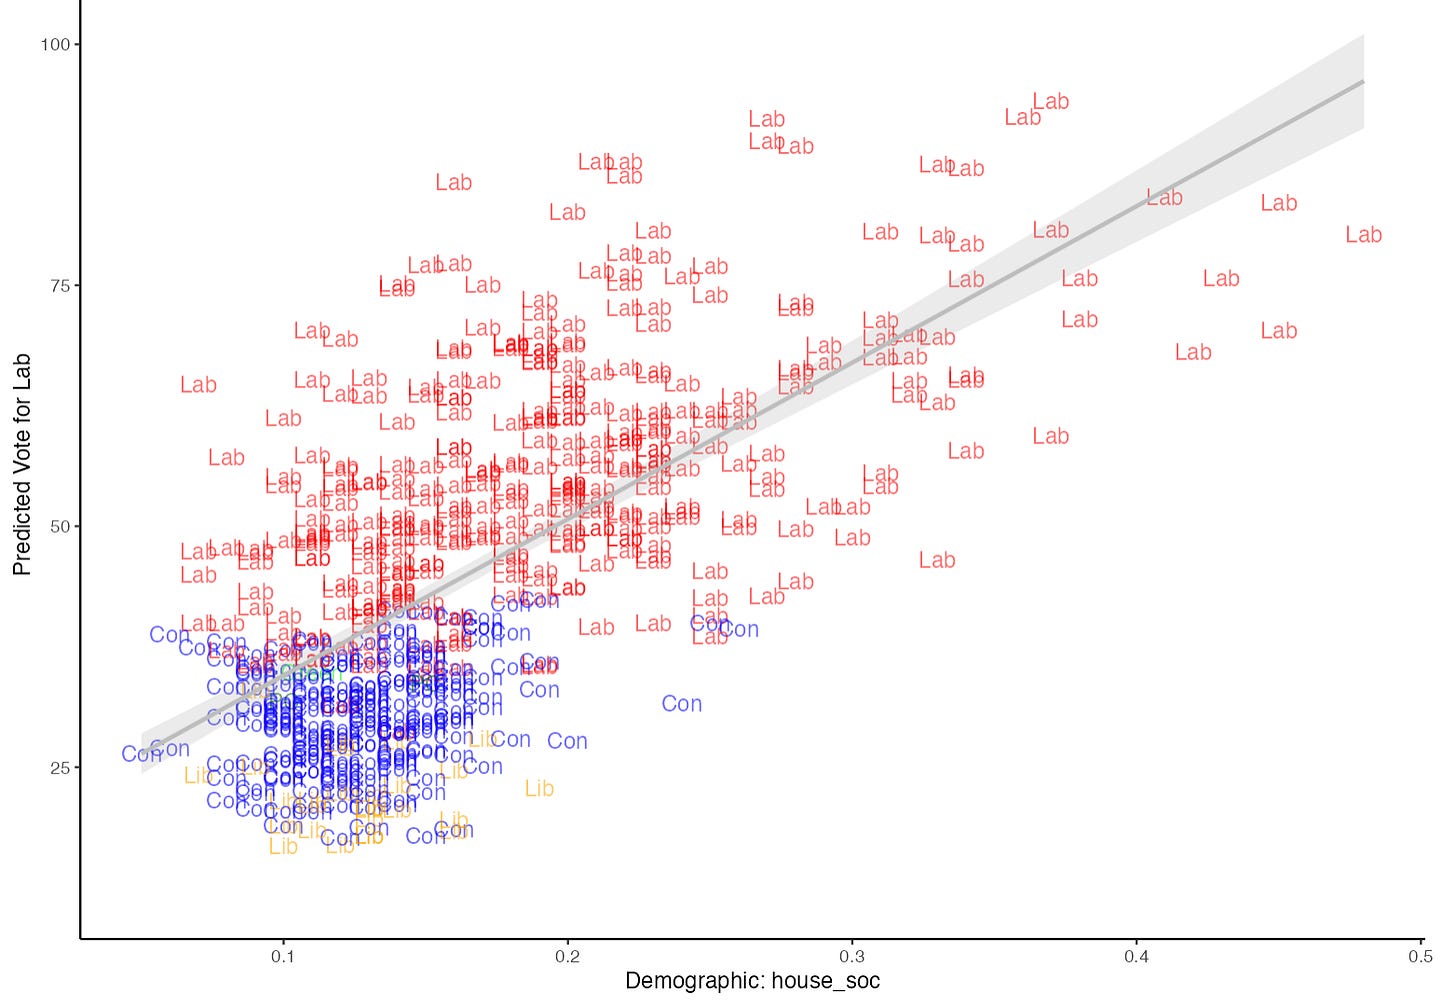
It’s a similar story for places with lots of social renters - except for a couple of outliers, everywhere in England and Wales that has more than twenty percent of households in public / social housing voters Labour. The crazy thing about this is that in 2019, older social renters were a major support group for Boris Johnson (old social renters had almost always voted Labour before). I suspect that this group is one of the ones that has swung back to Labour hardest, and explains why Labour are cautious about issues that concern people who are socially authoritarian (immigration, crime and Brexit).
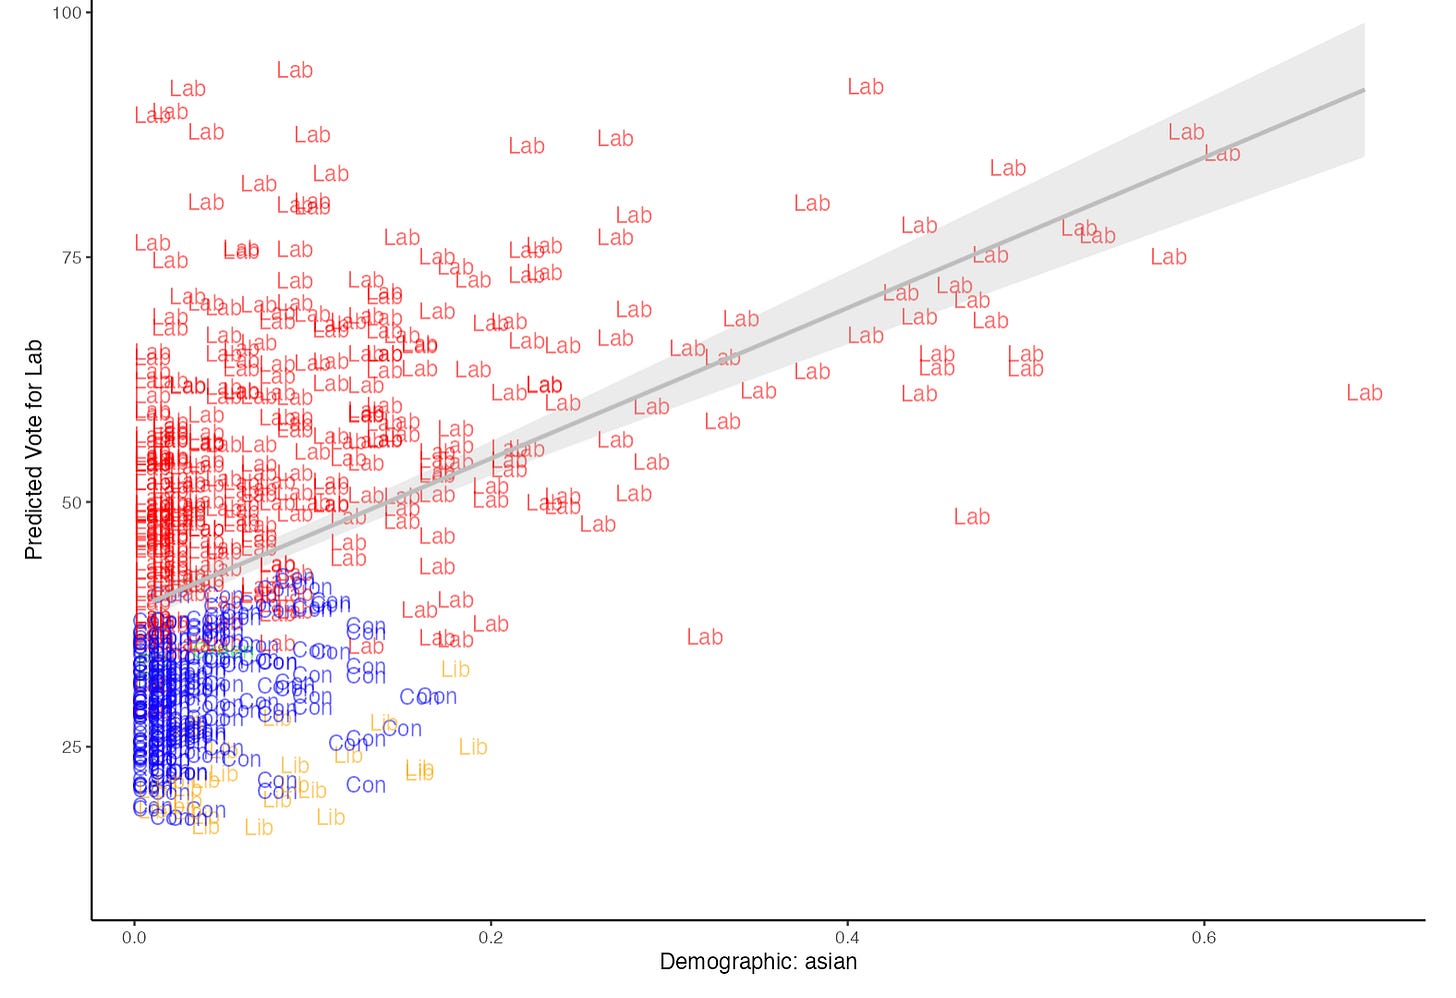
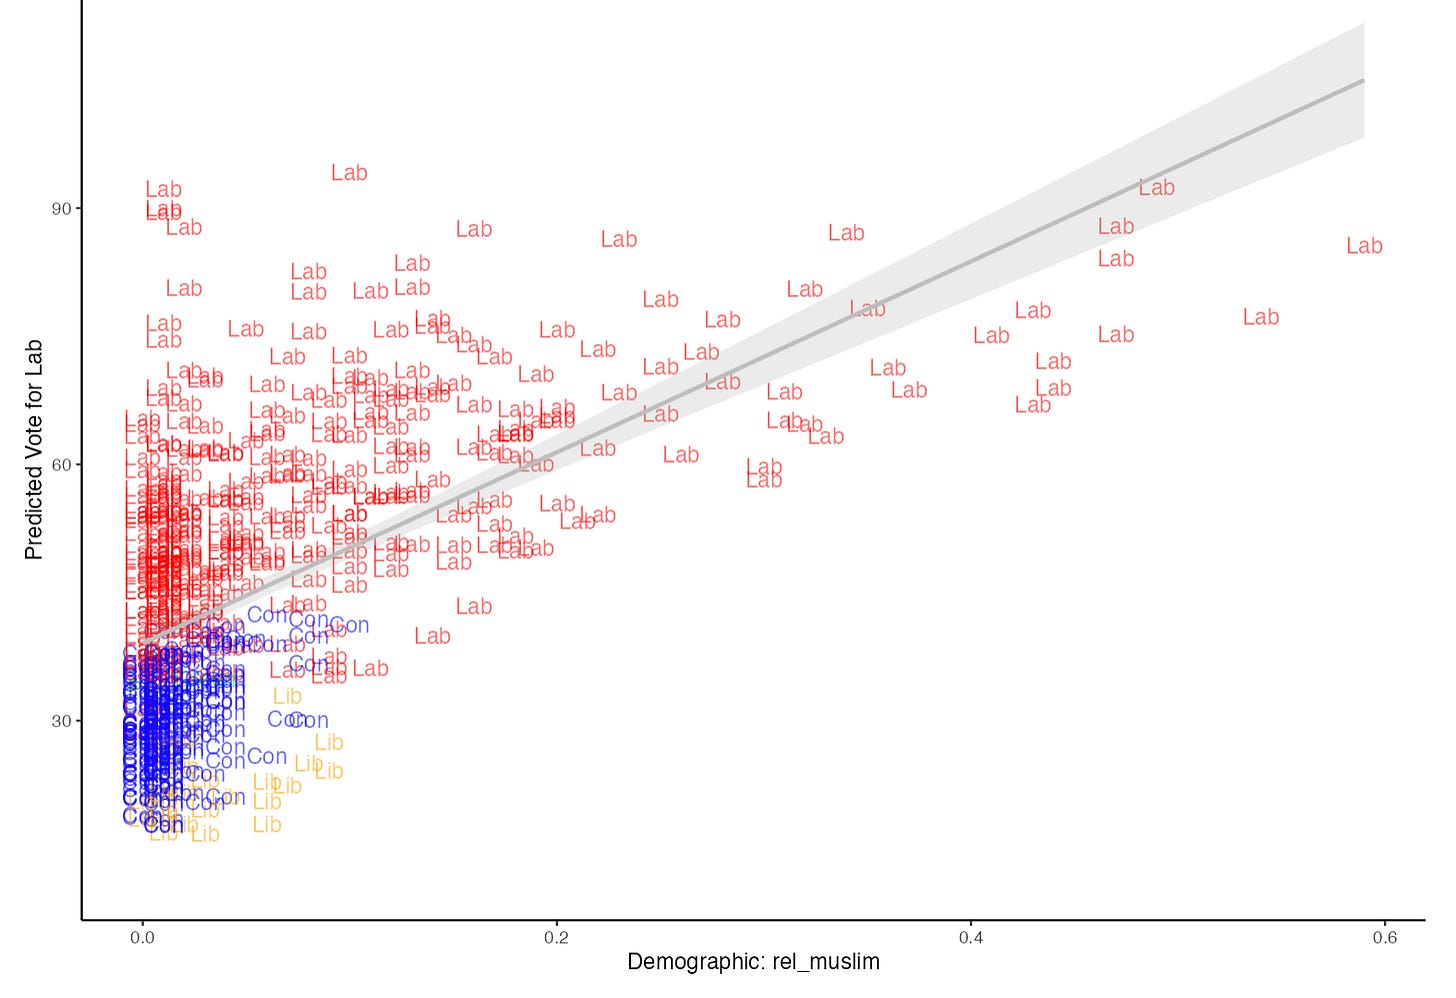
Finally, it’s also worth looking at the ethnic and religious demographics of the Labour vote. Under current polling, Labour win every seat that is more than twenty percent Asian (and over fifteen percent black) and every seat that is more than ten percent Muslim.
Put this way you can see how predicted votes (as things currently stand) in the next election will mean that only Labour represent constituencies with large numbers of ethnic minorities or Muslims (obviously these are collinear in the UK). It also helps explain why Gaza has been such a difficult topic for Keir Starmer.
But most of all, these demographics show that if things stay as they are today, the Conservatives will be a party even more dominated by the old, white, and home-owning set. Labour by contrast will have a demographically very diverse voting base.
The danger for the Conservatives is that, particularly given how their membership generally behave, they will double-down on the policies that this group like and tie themselves to a declining proportion of the population. The further danger is that identity politics become even more racialised and age-based than they currently are as one party becomes extremely homogenous and looks to garner media attention after they lose an election. It could get nasty.
There are dangers for Labour too, though ones that most parties would rather have. Their electorate will be very diverse in every sense. Policies that help renters may hurt those homeowning areas that have flipped to Labour. Very white districts may resent very diverse districts (and vice versa). Most policies don’t help all age groups equally.
These are the tradeoffs that a governing Labour Party would have to make among the people who voted it into power. And those people will disagree on a lot, just as a more homogenous Conservative Party in opposition finds unity in a much smaller base. Our politics will still be angry and discontented - at least until there is sustainable economic growth. But the tenor and tone will be new. So let’s enjoy the novelty of disagreements sung by a different choir for a while. Still dissonant. But a refreshingly new dissonance, I suppose.
If you enjoyed this post, please subscribe. Or even better, buy a copy of Why Politics Fails, now conveniently available in paperback at even more bookstores than the hardback was! Even WHSmith at the airport. You can order from Waterstones here. Or at the behemoth here. North Americans head here (not PB yet). It’s also now available in Spanish and Greek bookstores in translation (producing my first ever Greek hatemail!). German, Portuguese, Japanese, Korea, Chinese, to come.
If you prefer audio-Ansell, you can listen to my BBC Reith Lectures from late last year (and to my recent chat with Katya Adler and Stuart Russell on AI and elections) here, to my recent appearance on BBC Newscast talking about this year’s upcoming elections with Adam Fleming here, and finally to my recent chat with Ed Miliband and Geoff Lloyd here.







Interesting that the Lib Dems don't do especially well with either renters or outright home-owners. A party of people with mortgages.
This ended up being remarkably predictive of the start of the Tory general election campaign!