Tactical Coping
The local elections look bad for the Conservative Party regardless of what polls you use.
Some Bank Holiday Monday reading for you all. A quick-ish Substack from me, but one built around a General Election app I’ve developed over a number of years and just updated today. Do you want to see what polls predict for the next election? Do you like bar graphs, scatterplots AND maps? Well you’re in luck. Click here for the app.
In other news, if you would like to see my discussion with the wonderful John Simpson about Why Politics Fails you can watch it here, and of course buy the book here.
It was the best of local elections, it was the worst of local elections. Either Labour are on the march, destined for a Blair-like majority. Or perhaps it’s an orange dawn, with the resurgent Lib Dems forcing Labour to consider a hung parliament, coalition, and curse upon curses, electoral reform. Or, ‘whisper it quietly’ (as the kids say), maybe Labour under-performed and the Conservatives really can sneak back, as the leading party, maybe even with a majority. Cope is a helluva drug.
Standard party spin aside, why have there been so many different interpretations of the local election results and what they mean for next year’s General Election? The reason for confusion - and hence the license for Dan Hodges style ‘coalition of chaos’ headlines - is because the current national polls and the ‘estimated national vote’ from the local elections are pretty out of whack. Not for the Conservatives, mind. It looks fairly terminal for them either way at under thirty percent in polls and in the estimates from the locals. But for Labour - who are flying at around 44-45% support in most national polls but plodding along at around 35% in the estimates building off the locals.
The difference of course is the Lib Dems who might be picking up their standard 11% (as in national polls) or be at 20% (as in the locals) doing a remake of Cleggmania / Cablecarnage / Swinsonshine / Dav… uh… I’ve got nothing. And not just the Libs. As has been the case for a number of years, the Greens continue to do very well in local elections. As do the mad array of local independents that dominate councils across the country from Ashfield, to Boston to Castle Point. The BBC estimate is that independents plus Greens and other parties received nearly twenty percent of the vote!
Which set of polls is right? Are we due for a Labour majority, or a Labour-led coalition? Or even, should you be the kind of person who might bet on Southampton - Rishi Sunak’s favourite team - staying up, a continued Conservative-led government?
My classic academic answer is… drumroll… both polls are right. They are just measuring different things. National polls put together two motivations - who would I like to be in government, and who would I vote for in my particular constituency in a General Election. At this stage in the electoral cycle, they are really measuring the former as people haven’t yet put a great deal of thought into the need for tactical voting in their constituency. They might be thought of as similar to the set of votes and seats you’d end up with if we had national-level PR. As we get closer to the election, I’d expect some adjustment towards constituency-level tactics. But right now I think they reflect mostly sincere preferences.
Projected estimates from local elections are also putting two things together - what actually happened on election day in the not necessarily representative set of councils that got to vote (Oxford, for example, didn’t), with a national level adjustment to account for the particular set of councils that had votes. Actual elections, including locals, do see tactical voting, since each ward is elected (just like Westminster constituencies) through first past the post. So if we wanted to see what tactical voting could look like, the local elections give us some information. In other words, the results we just saw in the locals reflect strategic preferences.
We ought to be careful though - local elections are weird. Fewer people vote. They vote about local issues, where parties such as the Lib Dems, Greens and Independents have strong reputations and preferences. Sometimes even about things other than blocking houses being built.
Caveats aside. The way to reconcile what’s going on is to note that on election day, people who in national polls may say they support one party, are quite likely to defect to another party, if by doing so they can keep out a party they hate. They will vote tactically just like they did in the locals.
Let’s put some flesh to those bones. Bluntly, there is a large anti-Conservative coalition in the country (perhaps we’ve found Liz Truss’s ‘anti-growth coalition’). Labour voters, Lib Dem voters, and Green voters would, I warrant, largely prefer a Starmer-led government to any continuation of Conservative rule. I am sure there are exceptions, after all there was an LD-Conservative coalition in 2010! And some Green voters are Ottolenghi Conservatives, to coin a phrase. But importantly, I think the Lib Dems have detoxified enough for many Labour voters to support them where the Lib Dems are running second to the Conservatives.
Paula Surridge has smartly remarked that maybe we should be thinking about ‘negative partisanship’ rather than tactical voting. But I guess in this case, it will be kind of the same thing. Even in the absence of any formal coalition between the respective parties, Labour, Liberal and Green voters can create an effective alliance themselves if they are willing to coalesce around whichever candidate in a constituency runs best against the Conservatives.
So I promised a fun app. Maybe you just went to that and stopped reading several paragraphs ago. Forza! But let’s say you waited. Well you’re in for an interactive treat.
My General Election Predictor app allows you to enter any set of polling results for the main parties and will use Uniform National Swing (TM, the late great David Butler) to calculate which party will win each constituency. I’ve made apps like this before but the latest greatest version has a couple of neat tweaks.
Here’s a screenshot to whet your appetite:
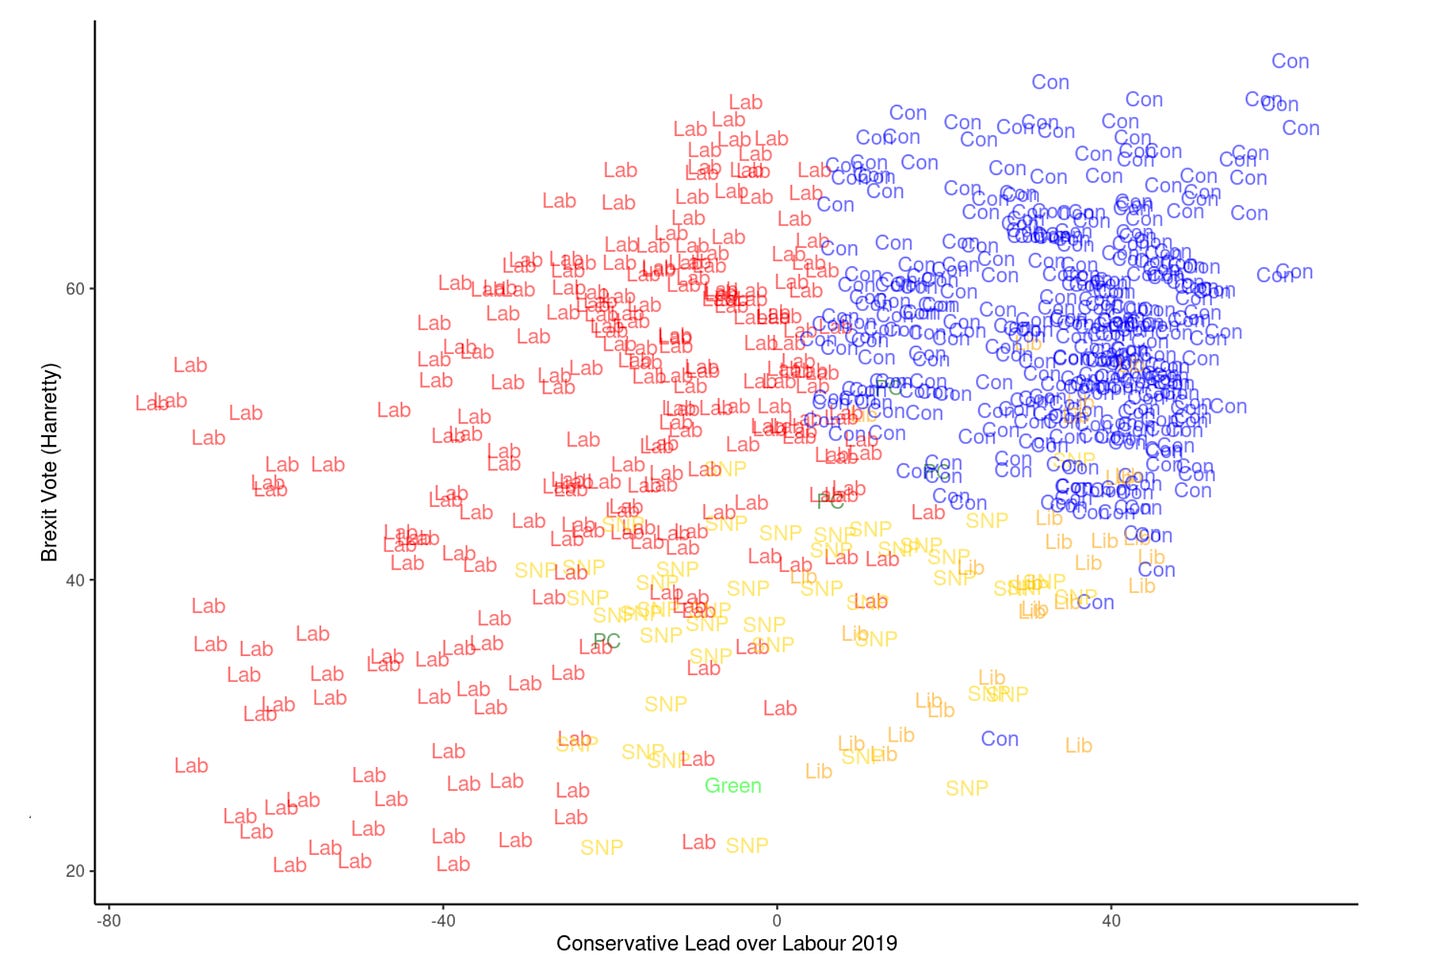
First off, you can now look at the seat predictions either as a bar graph (the default), a scatterplot (where the x-axis is the Conservative lead over Labour in 2019, and the y-axis is Chris Hanretty’s estimate of the constituency Brexit vote), or as a hex-map.
Second, and for this Substack post more important, you can adjust an ‘anti-conservative tactical voting slider’, which allows you to move Labour, Liberal, and Green voters in every constituency towards the candidate from those parties who did best in 2019. While this also applies to Scotland, I have not made any attempt to move SNP voters around because… well who knows.
Now this is a wee bit crude because as you move this slider to one, everyone flocks behind the leading party, even in places where, let’s say Labour has a super-majority already. Nonetheless, as you move the slider you’ll see that the seat patterns change. Even for the actual 2019 vote, which is the default for the app. And you’ll also see in this case, it wouldn’t have helped Labour hugely. With 100% tactical voting, they would still have had just 243 seats, though Boris would have only had 309. Note though, I leave Northern Ireland out, so Boris could have had another supply and confidence deal with the DUP. Yikes.
One more thing to note, as you move the tactical voting slider, you will see the final aggregate vote shares of each party change from the ones you input in a text box under the figure. You can think of what you input as people’s ‘sincere preferences’, and the final aggregate shares as reflecting strategic voting on top of that.
So finally, with this app in hand we can answer the question about whether Labour should be worried. They shouldn’t. Though the Conservatives should.
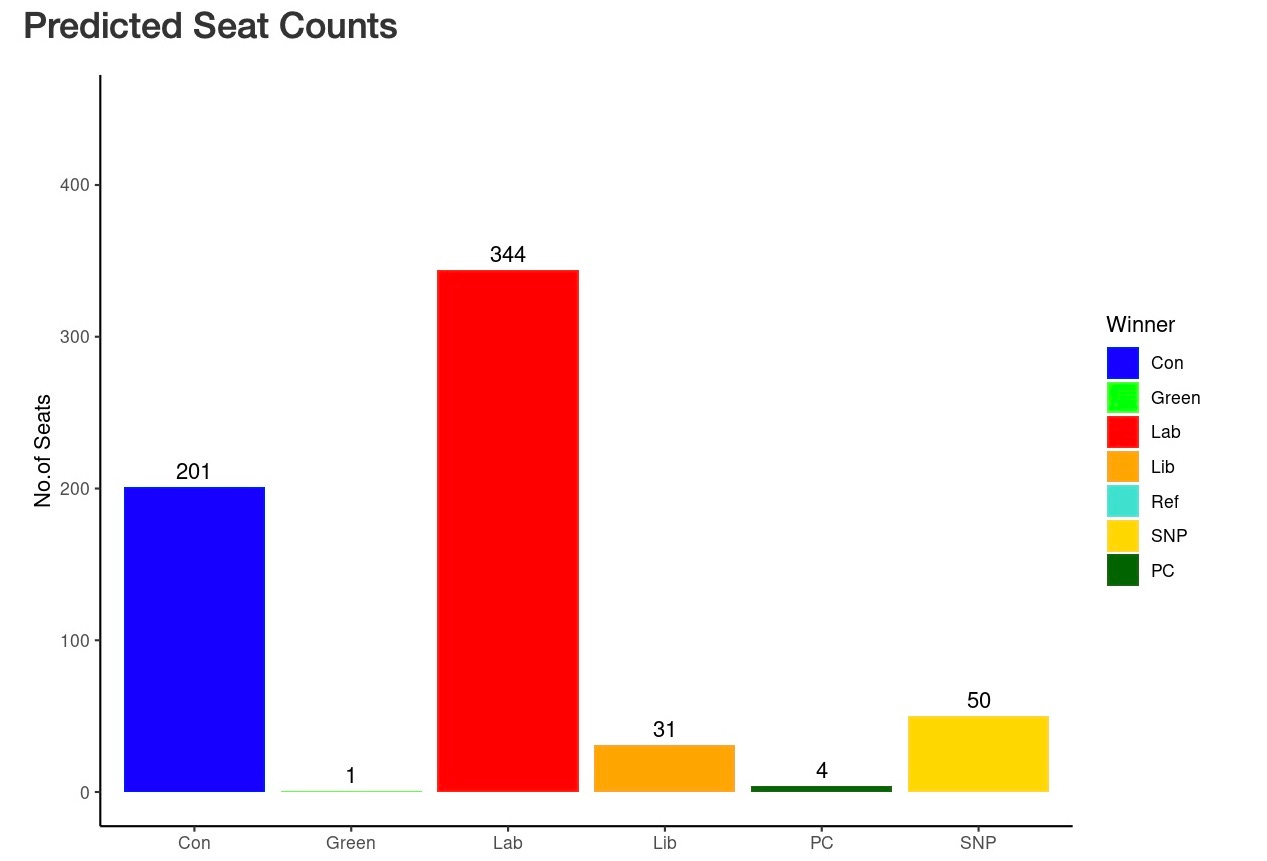
Imagine a world where people’s sincere preferences are what we see in the current polling averages. I will use @BeyondTopline’s recent polling average: L: 44. C: 28, LD:11, Ref: 5.7, Green 5.2. And I’ll keep SNP and PC like they were in 2019 (might be a bit too favourable to them). Here’s what my predictor spits out as a bar graph, scatter, and map.
If you want to know which constituency is which, you’ll have to go to the app where you can click on points in the scatterplot, or hexes in the map, to find out. Substack does not allow you to embed Shiny apps yet. Probably a good thing really.
IMO this is a decent but not Blair level result. Not even quite Johnson. But strong - an actual majority of almost fifty and a de facto anti-Conservative/DUP majority in the hundreds.
So this is the kind of thing that various election predictors spit out with current polling with slight differences depending on how you do Scotland (which I am not doing separately here, so I think this is a bit SNP friendly) and the kind of swing assumptions you make. But most things give us a ballpark of strongish Labour majority.
And then there is the John Curtice BBC forecast from the local votes: L 35, C 26, LD 20, Others 19. If you put that in the app (which I do by giving Reform UK and the Greens lots of extra votes basically) you get this:
Oooh. That doesn’t look so good for Labour at all. Now they have either to be a minority government or an official coalition with either the Lib Dems or the SNP. Or both, if you were mad.
On the other hand, this is not bunting and parades material for the Conservatives either. They are miles away from a majority and that’s pretty much the only way they stay in office (well that or a bit short and a deal with the DUP… again). I am assuming the Lib Dems will never never never never form a coalition with the Conservatives again. But the party does have a knack for steering directly into clearly marked bear traps so who knows. Still, a Con-Lib coalition isn’t possible either here.
With twelve to eighteen months to go it’s not completely mad for the Conservatives to think they could pull things back and really what else can they do? Still, if I were a columnist for a right-leaning newspaper (and it’s the UK, so take your pick), I’d definitely be cracking out the ol’ Photoshop of Starmer in Hamza or Ed’s pockets.
But now allow me to rain again on the Conservative parade. Soggy bunting and tears. You see, the local election based forecast reflects actual (strategic) voting, much of which was strategic. Whereas, as I’ve noted ad nauseam above, national polls better reflect sincere preferences.
If you look at the app you will see it has a line below the figures saying, ‘Aggregate Vote after Tactical Voting’. And if you look to the left, you’ll see the slider saying ‘Anti-Cons Tactical Voting’. A reminder, at zero, this slider means no tactical voting. At one, it means every Labour, Lib Dem, or Green voter in a constituency votes for whichever of those parties did best in General Election 2019. And as you pull the slider from left to right and increase tactical voting you will see that the ‘aggregate vote after tactical voting’ diverges from the sincere preferences. What you end up with, after tactics, differs from what you enter as national polls.
It’s true that John Curtice’s local election based estimate doesn't look great for Labour if you assume Uniform National Swing. But what if it reflected tactical voting? How much tactical voting might it take to get parliamentary results that look like what the national polls suggest. Not much.
If, starting with Curtice’s estimates, just thirty percent of Lab/Lib/Green voters back the GE19-leading one of these three parties in each constituency, then we get the following prediction.
Notice a couple of things here. We have shifted about two percent of Green voters and 2.5% of Lib Dem voters to Labour in the aggregate (so things look a little more like our national polls) but somehow the Lib Dems have got another 11 seats and Labour have gained almost forty. This puts Labour at more or less the same number of seats they have if you took national polls seriously but the Lib Dems do far better than current polls suggest, taking about forty seats from the Conservatives.
I think this kind of pattern is what we saw evidence of in the locals. Of course things are much more complex than in my model. For example I doubt Lib Dems are flocking to Labour candidates in Labour strongholds but my model makes them do that. So I wouldn’t read a huge amount into the change in the aggregate vote part. But the way that a fairly meagre Labour overall vote share can translate into the abasement of the Conservatives with a minimal amount of tactical voting - that bit I trust.
In sum, a fairly reasonable estimate of tactical voting makes it very very very hard for the Conservatives to break 200 seats, let alone get to a majority. And indeed, tactical voting by Lib Dems and Greens actually makes a Labour majority more likely, as well as enhancing the Lib Dem seat count massively. Sorry Greens but your starting position is too poor for my model to help you out. But that said, I can totally imagine a world in which this kind of behaviour gets the Greens a few seats in the kinds of places where they are doing well in the locals (Cotswolds, Suffolk, etc).
And there is an irony here - one similar to the Blair era. From 1997 to 2005, the Liberal Democrats had their best ever hauls, getting up to over sixty seats in 2005 (more than post Cleggmania). And yet, they were locked out of government because Blair (and Brown) always had a sizeable majority. Tactical voting helped the Liberals win seats for sure. It just also helped Labour enough that all those Liberal gains didn’t matter. One of the many curses to have stricken that unlucky party.
But cry not for the Liberals, who are likely to have scores of new seats following the next election. It’s the Conservative Party who should be worried. Because they’re done for if they can’t scare Liberals and Greens away from voting for Starmer’s Labour or somehow convince Labour supporters not to back the Liberals in the Blue Wall.
Last time round the Conservatives had a handy-dandy horror mask to frighten Liberal leaners with - the spectre of Corbynism. That’s largely gone and instead they have to deal with the undead Johnson /Truss supremacy lurking behind the new Sunak veneer of competence.
Sunak’s emphasis on delivery is probably the best bet they have, not least because the banging of the culture war drum doesn't seem to have been especially effective during the locals. Indeed, UKIP lost their final elected councillors this election and Reform UK managed only two new councillors to reach a grand total of six nationwide. So I don’t think leaning back into the alleged realignment offers much succour. Might as well at least try to govern properly and, if lucky, garner some votes that way.
In the end, my guess is that tactical voting will do for the Conservatives regardless of the level of Labour’s polling. As we saw with the app, just a small amount of anti-Conservative coalescing has dramatic effects. There’s not enough copium in Britain to get around that.
If you enjoyed today’s post, you’ll be delighted to know I have a new book out. Why Politics Fails was selected as an ‘unmissable’ politics book in Waterstones’ April monthly newsletter. So, don’t miss it! You can order from Waterstones here. Or a signed copy from Topping here. Or at the behemoth here.
And if you don’t subscribe - my Substack is free so please click below.


Very engaging! Thank you for writing this up. I am going to gerrymander the term "Ottolenghi Conservatives" into my teaching next year, I think. I also, on the subject of enthusiasm for Ed Davey, humbly submit the DaveyTrain.
I wonder if the voter ID thing selected out Lib Dem voters this election.? When will we get any data on how it affected the turnout?