Every political party has to make a bet on what coalition of people in society can push it to victory. Parties, of course, have ideologies. They cannot be a million different people from one day to the next. But they do need to adapt to the electorate if they want to survive, at least in functioning democratic societies.
The reigning champions of this exercise for the past few centuries have been the UK’s Conservative Party. They have morphed from a pro-Restoration, anti-Parliament faction in the 17th century; to a half-century minority chafing at Whiggish corruption; to an all-conquering embodiment of Burkean resistance to revolution; to harried defenders of a restricted franchise and aristocratic privilege; to opportunistic advocates of expanding the franchise and One Nation imperialism; to small-state protectionists; to defenders of the cosy post-war welfare state / free-trade consensus; to free-market fundamentalists; to managerialists; to hoodie-huggers; to Brexit realists; to Brexit surrealists; to libertarian self-immolation; and finally to tech-hoodie fiscal conservatism. It’s been some ride.
This ideological flexibility has been predicated on the need to win elections, at least for the past 150 years of the party’s history. The Conservatives have mastered the art of straddling the nation’s divides - sometimes tying together socially liberal yuppies with retired generals; other times tying together working class retirees in post-industrial towns with… retired generals. In the most recent manifestation - the 2019 General Election - Boris Johnson won a huge parliamentary majority, and a sizeable share of the votes cast, by bringing together traditional Tory bases - managers, small-business people, rural residents - with poorer voters from the famed ‘Red Wall’ in the post-industrial Midlands and the North.
How sustainable is that coalition? Where did it come from and when? In this post, I’ll start with historical voting patterns for the Conservatives and then I’ll turn to a survey I ran a couple of weeks ago. I cannot promise all Substack posts will involve a grand historical narrative followed by original survey data but today’s a good day. So let’s begin the graphfest.
In our forthcoming chapter in the IFS Deaton Review, my Oxford colleague Jane Gingrich and I look at fifty years of British elections from the 1960s to 2019. We took every British Election Survey back to 1964 and ran some simple vote choice models, looking at the relationship between age, education, income, homeownership, and gender on voting Conservative in each election. I promised in my last post there would be graphs. So here we go…
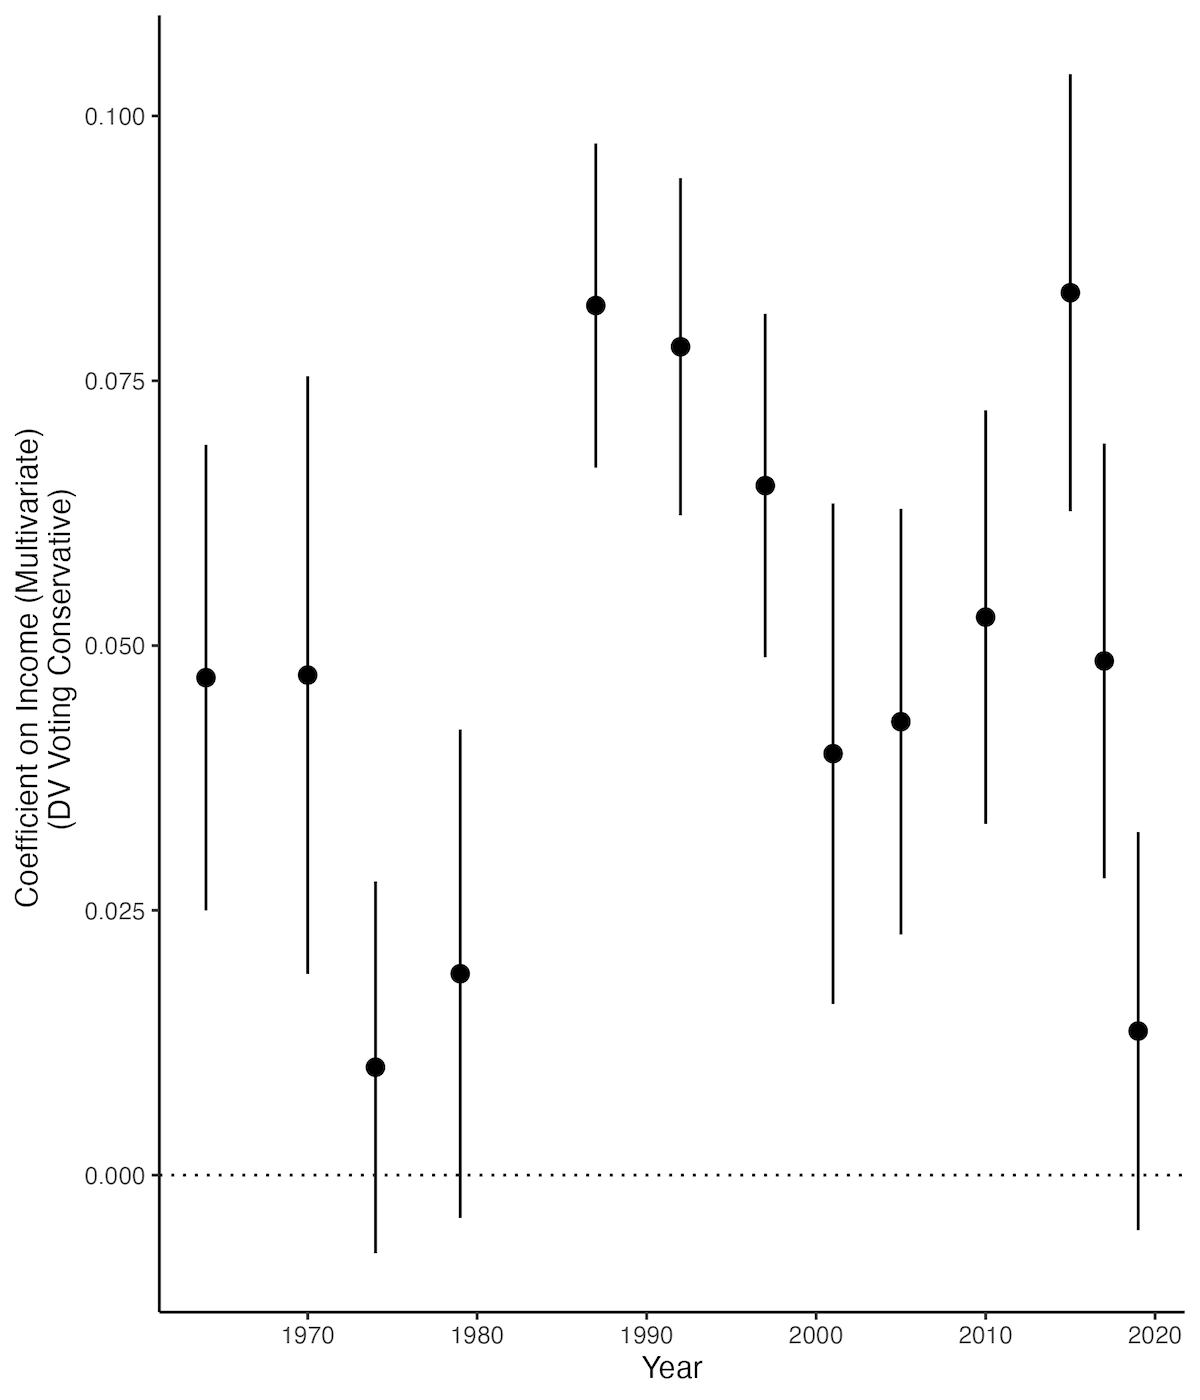
What on earth? OK let me explain. This figure shows the predicted relationship between respondent household income - split into five quintiles for each election - and the probability of voting Conservative. This is a simple ‘linear probability model’, which means you can interpret the y-axis as the difference in probability of voting Conservative as you increase income quintile (i.e. from the 1st to 2nd or 4th to 5th). The model controls for the other demographics - so this is the relationship between income and voting Conservative netting out age, education, homeownership and gender.
What do we see? On average, for every income quintile we go up, we get a five percent point higher probability of voting Conservative. So, as we rise from the poorest to richest quintile we get a twenty-percent point higher probability - which feels reasonable to me. Now, income doesn’t always gave this effect. In the tumult of the 1970s it didn’t. But from the late 1980s onwards through til very recently, the Conservatives could rely on higher income people as their base.
And then 2019 happened. Here we see the coefficient drop precipitously - essentially to statistical insignificance. That’s right, household income doesn't predict the vote in this simple model of 2019. So what does?
No prizes for guessing. Education is our new political divide. Back in the 1960s and 1970s, people with higher levels of education were generally more likely to vote Conservative. But by the 1990s this had shifted to a null or slightly negative effect. But look what’s happened since 2015. Our education variable here is a three-point scale (lower-secondary, upper-secondary, degree), and a shift from those with the lowest to those with the highest education now is associated with a twenty-five point decline in the probability of voting Conservative. Education is the new income. But in reverse.
Now what could possibly have led to this change? First off, this is happening everywhere in the wealthy world - graduates have been trending left in America and in Europe for some time. There’s an interesting debate between Thomas Piketty on the one hand, and my colleague Tarik Abou-Chadi and Simon Hix on the other, about whether there is a ‘Brahmin’ educated left.
But in the UK in 2016… something happened. It’s easiest to view through the lens of constituency voting patterns. Here are three graphs (also from our IFS Deaton Review piece) that tell a story.
Here is the 1997 General Election. We are comparing on the x-axis median house prices in that year for each constituency (logged) to the Conservative vote. I have helpfully coloured and labelled each observation so you can see who won. Labour won ALL of the one hundred constituencies with the lowest house prices. The Conservatives won 43 out of the 50 constituencies with highest house prices. Rich places voted Conservative. Poorer places voted Labour. This is the world in which today’s generation of MPs - of both parties - grew up.
Here’s another figure - the Brexit referendum. Here we are using Chris Hanretty’s estimates for the Brexit vote by constituency (voted were actually collected at the local authority level). It’s a similar upward sloping graph - except this time the y-axis is supporting Remain… I have coloured the points by who the constituency voted for in 2015. Still then, richer places voted Conservative. But now many of them were also voting to Remain in the EU. At the same time, poorer Labour voting places were often attracted to Leave. And this means by 2019, things had changed…
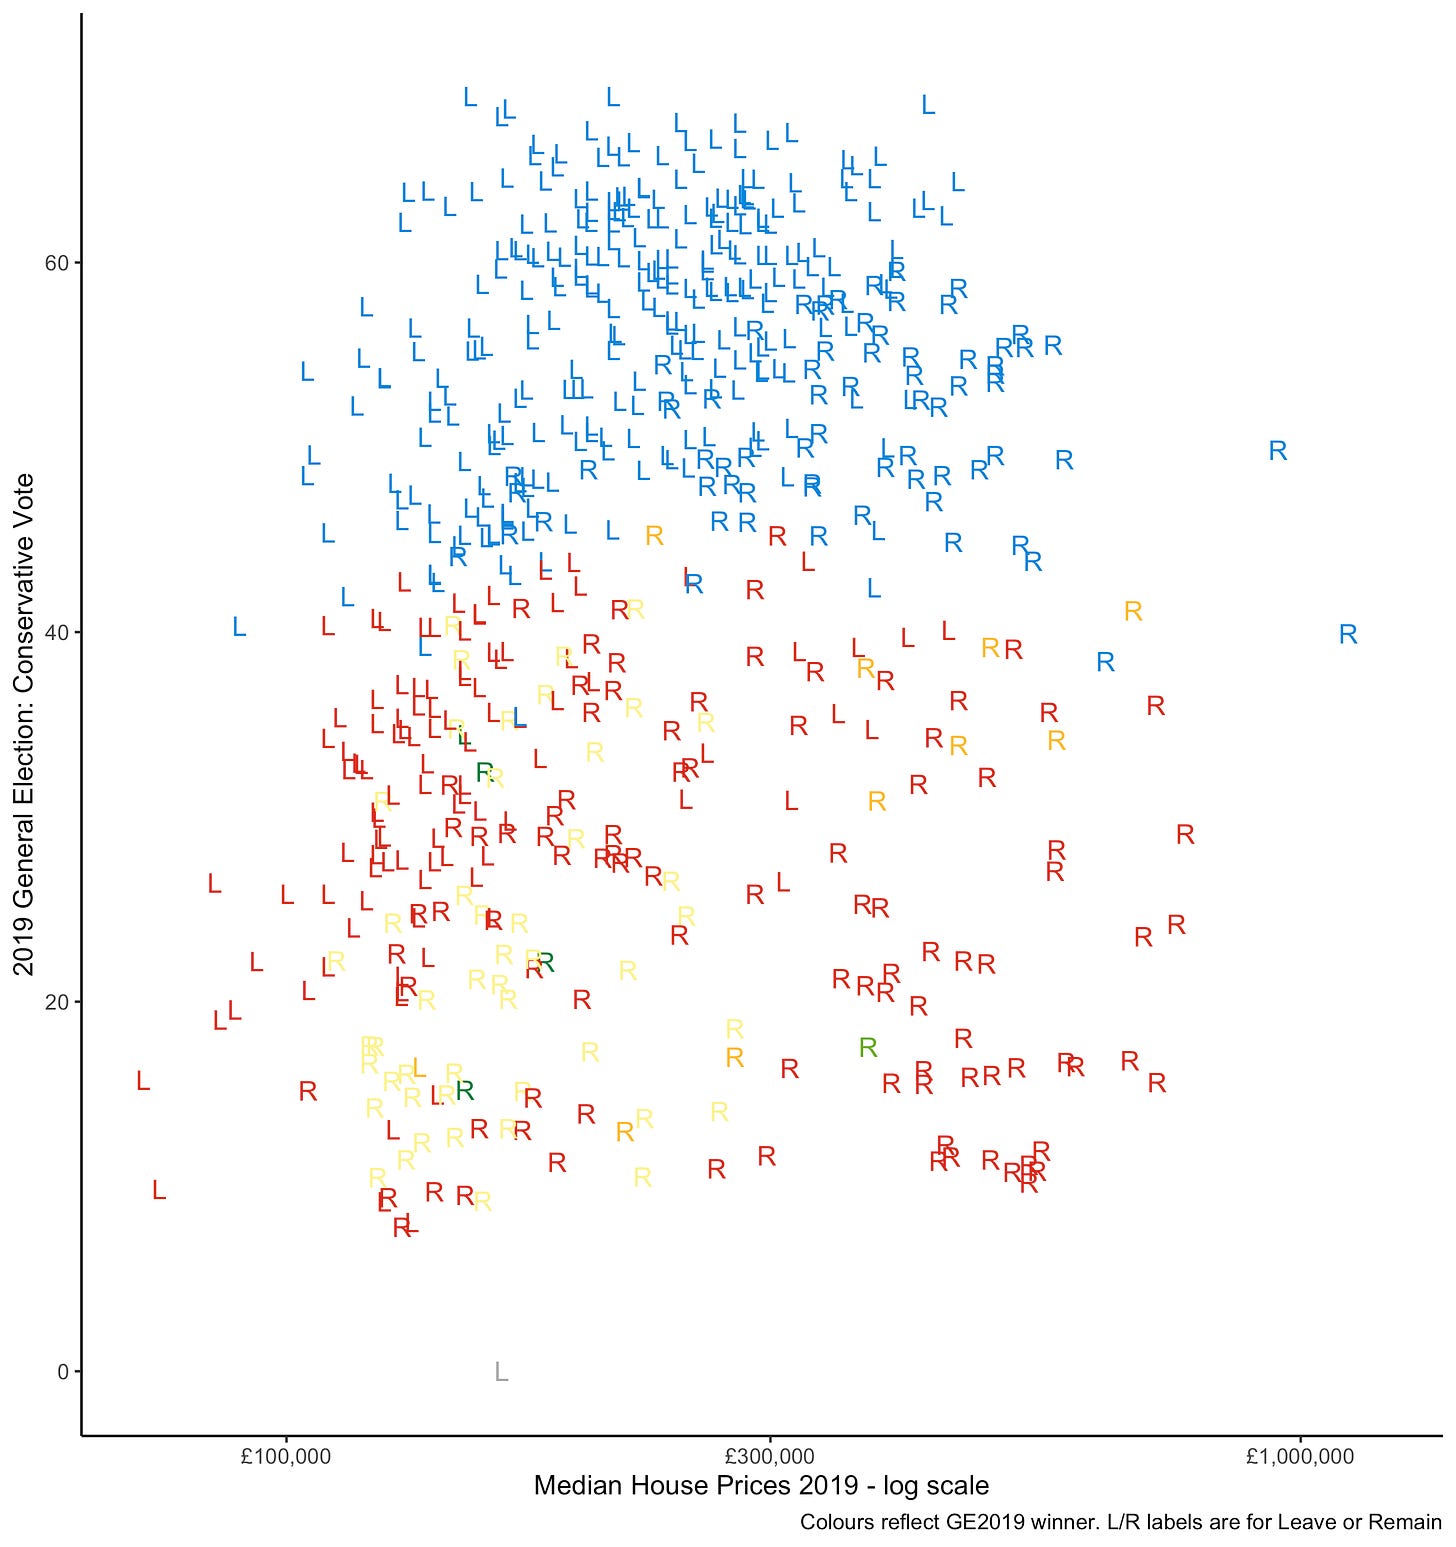
This is the same figure as for 1997 but now for 2019. You will notice one thing right away. There is no relationship between local house prices and voting Conservative any more. It is shaped like a blob. Or more imaginatively, a skull. If you squint, I suppose you could imagine an upside-down ‘U’ relationship. Johnson squatted across British constituencies like Tim Shipman’s proverbial giant toad. He was especially successful at bringing together a coalition of the pretty affluent and the pretty poor, leaving Jeremy Cornyn to sweep very expensive urban areas and really disadvantaged ones.
So that’s how you win a huge majority. You turn the axis of politics - a process called heresthetics - to create new coalitions. In this case, Johnson was able to use Brexit to capture the middle and poorer areas, along with the traditional Conservative base. It was a coalition built on the median Brit - not a degree-holder, increasingly old, living outside the major urban areas, and with median incomes.
But Britain is changing and Boris is gone. Not every political entrepreneur can shift the axes of political debate in the UK to tie together this new coalition. I am going to hazard a guess - call me crazy - that Liz Truss would not have been able to. In fact it’s not clear that Boris Johnson by 2022 could.
The problem that Rishi Sunak faces comes from two directions. The richer areas that voted Conservative before 2015 are full of high education voters who have fallen out of love with the Conservatives. And the poorer areas that Johnson brought into the Conservative coalition are struggling financially and, even if loyal to Brexit (which I suspect they may not be), are certainly not loyal to the Conservatives. Or to quote Gramsci, “The old world is dying, and the new world struggles to be born”.
In the last week of October 2022, I ran a survey of 3,592 UK residents with YouGov as part of my European Research Council WEALTHPOL grant. I’ll be writing on the results we have related to wealth taxation and so forth in the coming weeks but today I want to focus on vote intention.
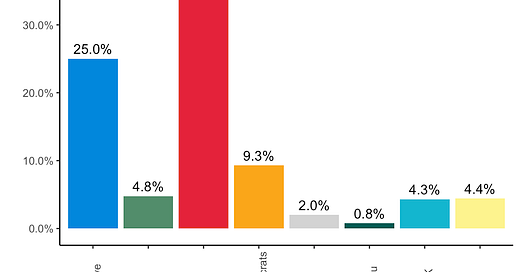
The vote intention figures from my survey were very much in line with YouGov’s other polling at the same time: Labour on 49%, the Conservatives on 25%, the Lib Dems on 9%, Greens on 5%, Reform UK on 4% and the SNP on 4.7%. So while I didn’t run my survey as a pure vote intention exercise, I’m comfortable that this sample is reliable for the following purposes. Here is the weighted vote choice for all people expressing a vote preference.
It’s also worth looking at the Don’t Knows, because they are a large group. So here’s the same figure with everyone in the UK included. Around a third of the DKs (in here as NA for ‘missing’) did vote Conservative in 2019, whereas only eight percent voted Labour, so all is not lost for the Conservatives. If we allocate across these DKs we get a gap of about ten percent points in the figure below (add ten to Cons, add three to Labour) or about twelve percent points if we add these previous voters to the previous graph (i.e. we assume everyone who said DK but voted for Conservatives and Labour in 2019 will do so in an election tomorrow). So first things first, let’s be cautious about the size of the polling gap that this and other surveys are showing. It is partly an artefact of ‘Don’t Knows’ that might come home.
But ultimately if people say Don’t Know, I prefer not to analyse them in a vote choice model when I look at demographics. So let’s go back to the people who expressed a vote intention and look at how education, income and housing matter. Let’s start with education.
We see some pretty striking stuff. We saw above how in 2019 graduates were twenty-five percent points less likely to vote for the Conservatives than people with lower-secondary education. We see a similar pattern here. The Conservative lag Labour among every education group (which is kind of amazing) but particularly among people with degrees. Labour have a FORTY-FIVE point lead among postgraduates and thirty points among those with degrees. This is… terrible for the Conservative Party, given that each cohort who enters the job market is around half graduates these days. It’s not like the Conservatives are even doing well with people who stayed at school until eighteen - here they are twenty-five points behind. Changes in education policy mean that it is now increasingly unusual not to have some kind of upper-secondary qualification among younger cohorts.
And yes, lots of this is a story about youth. Here is the same figure broken out by under and over fifties.
Ignore some of the weird things about sub-samples where the SNP are getting sixteen percent of the vote of under 50s with no qualifications - that’s a pretty tiny group. The big picture is that the Conservatives are ONLY leading among over fifties without a degree. And one quick glance at the top picture tells you that they are becoming extinct among the under fifties. They crack twenty percent support among only ONE group of under fifties. Those who got their GCSEs and no more. That is a small and declining share of the population, to put it mildly.
Some commentators (OK, reply guys on Twitter) have asked why the Conservatives are investing in education if it’s so closely correlated with support for Labour. My answer is that they are not evil or idiots. Conservatives don’t support school funding for political reasons; they do so because a modern services-based economy cannot possibly succeed with the education system of the 1950s, despite what boomers down the pub may tell you. The problem is they may support funding education but the educated don’t support them.
You know who else is worried about the Conservatives? People who don’t own their houses outright. Here we split out by housing tenure.
Who are the people affected by higher interest rates? First off mortgagees, where the Conservatives lag Labour by 28 points. Second, private renters who are paying off their landlord’s mortgage, where the gap is 46 points. By contrast the Conservative base is concentrated among owner-occupiers, who might quite like higher interest rates. The Conservatives - amazingly - do better among council house tenants than mortgages or private renters. This is like bizarro-Thatcherism.
We can also look at support just among homeowners (outright or with mortgage) by house price. In our survey we asked people to estimate the price of their house, which we have found to be pretty accurate, compared to local authority estimates, in previous work.
Here we see the Conservatives lagging everywhere except among SOME of the people with the most expensive houses. Obviously the sample sizes are getting small in the last few groups (100, 50, 50 roughly). But regardless, it is still striking to see a huge Labour lead among the £800k-£1m set.
Finally, let’s look at household incomes. Somehow, somehow the Conservatives are contriving to lose among every income group but particularly among higher income voters. Even in the £100K plus group they are lagging by almost twenty points. Where are they doing best? In the very poorest households (likely retirees). This is a COMPLETE reversal of traditional British politics. And it is pushing the Conservatives into an uncomfortable place where their traditional policy preferences are at odds with their support base.
So what are we to make of this? As I mentioned in my Twitter thread talking about these results, the Conservative Party is increasingly reliant on an older, lower-education, lower-income group of voters who own their houses outright. Aka pensioners. Which explains a good deal about the policy priorities of the government in recent spending rounds and the fallback to culture war issues for want of anything else.
But it likely means future electoral doom unless they can pivot back to some of their previous high-income, high-education, mortgage-holding voters. You know, yuppies. Or centrist dads.
Boris Johnson created a phenomenon electoral coalition. But it has withered and all that’s left is retirees. There are many many retirees out there so the Conservatives are not entirely doomed. But it’s not the ideal basis for a future electoral strategy.
During Boris Johnson’s era in power lots of people made a series of ‘emperor’s new clothes’ style arguments that he would get found out and be forced into some kind of embarrassing perp walk. But the real emperor’s new clothes may have been getting rid of Boris Johnson and discovering that without the hirsute blond wig and untucked shirt, the naked Conservative Party underneath lacks a coalition large enough to win elections today and, even worse, faces wipe-out in a decade unless it changes. Which, and here’s the good news for them, if history is anything to go by, it will.


Hats off! Excited to read more of these in the future!
strange numbers for SNP with no o-levels / GCSEs: in scotland we don't have A-levels, O-levels or GCSEs. those over 50 have O-grades, which are at least directly relatable to O-levels. maybe this is skewing the responses and you need to reword your questions?